News & Views: Open Access Charges – Popular Price Bands Become More Expensive

Last month, we looked at the headline price increases. This month, we look at spreads of prices and price optimization. In the following months, we will look at how the competitive landscape is evolving.
Each year we survey the list Article Processing Charges (APCs) of a sample of major and significant publishers. Covering over 18,000 titles, and going back to 2016, our data set represents one of the most comprehensive reviews of open access pricing.
Background
Market-wide headline price changes mask important nuances. We have discussed previously that the most important nuance lies in the spread of prices within a given publisher’s portfolio. For example, if the bulk of a publisher’s journals lie towards the lower end of its pricing, with just a few journals priced at the high end, the average (mean) price will be higher than most authors pay.
The following figures show how the spread of prices plays out in the market across our sample of publishers. The figures are outlines of histograms, showing how many titles sit in various price bands over the seven successive years of data we have curated. The red line shows the most recent year’s prices. The lines become greener as they go further back in time.
Hybrid Prices
The spread of price bands for hybrid journals is shown in Figure 1 below.
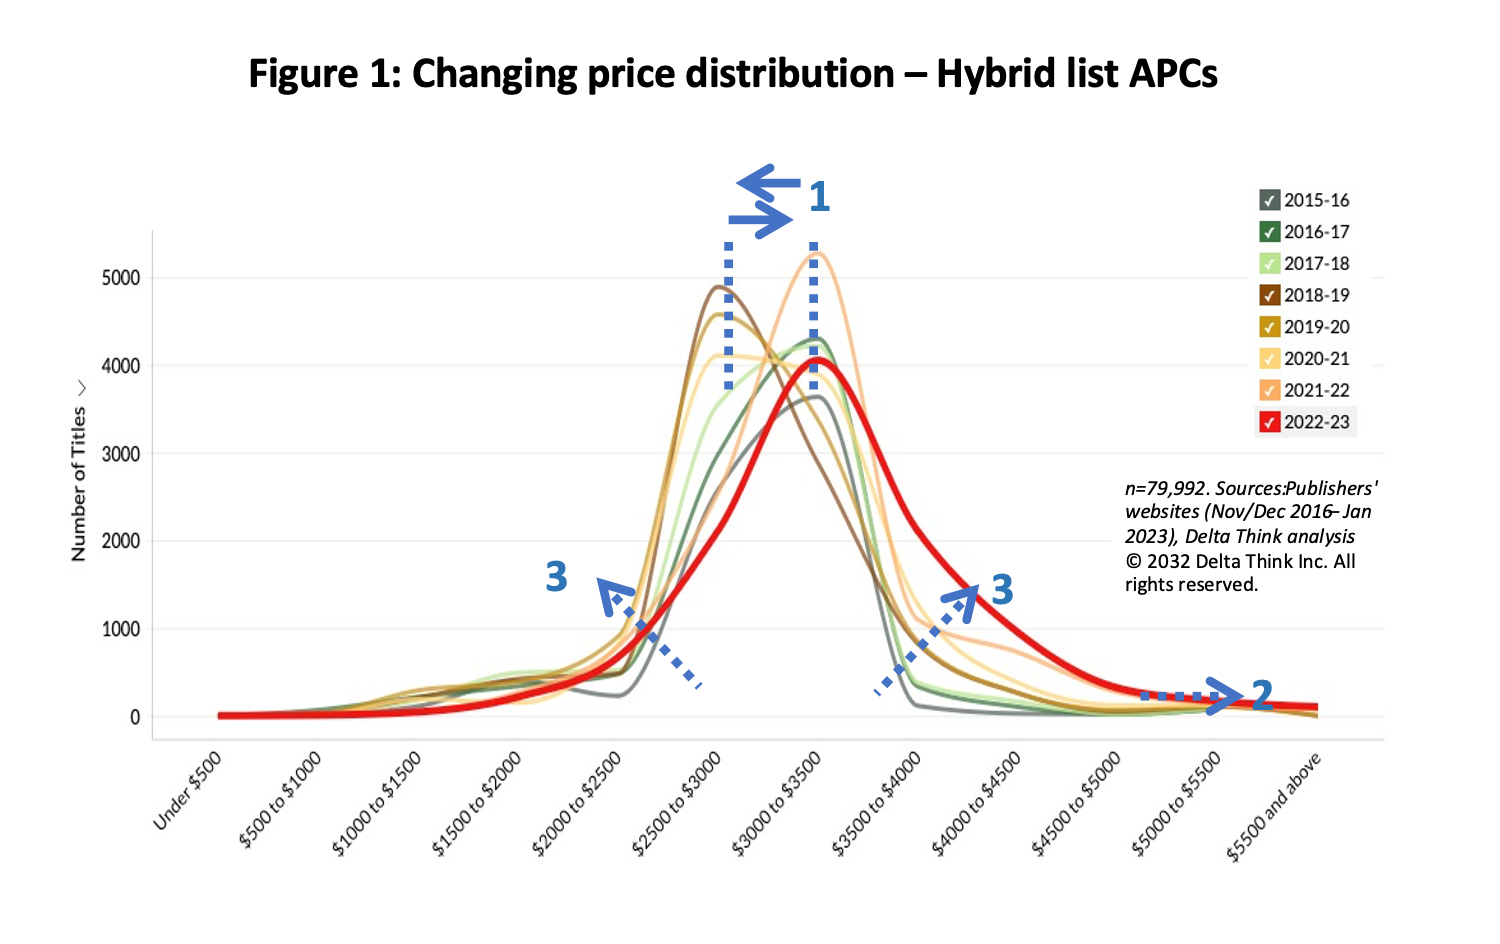
The overall spread of prices has remained relatively constant over time.
- A few years ago, in 2019-20, the most popular price band shifted slightly towards the lower end of the market and remained there for a few years. However, in 2021-22 it moved back up to its historic highs and remains there.
- The very highest prices increased three years ago, when high-impact journals started offering hybrid options. (For clarity, the chart combines the very highest APCs into one band on the right-hand side.)
- The curves either side of the peak are becoming shallower, suggesting increasing numbers of journals at price bands adjacent to the most popular one. The height of the peak has reduced, suggesting that the total number of journals has not changed significantly, and that we are seeing a movement in price bands of existing journals. Numbers of mid-high-priced journals show the largest increase. This will have the effect of increasing average prices paid, as higher APCs are becoming more prevalent.
Fully OA Prices
The fully OA landscape is shown in Figure 2.
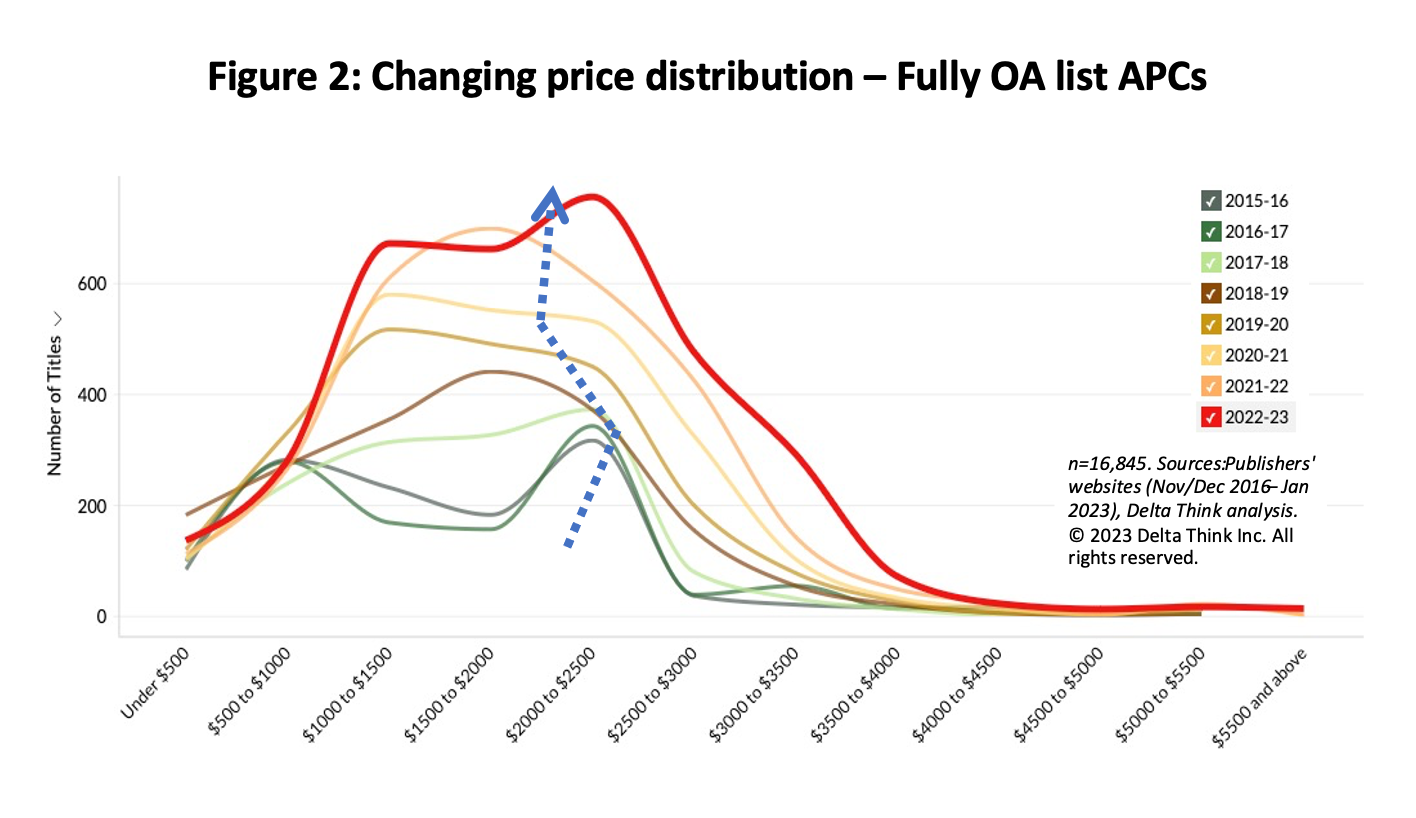
The data suggest that the number of fully OA journals and their average prices continue to increase.
- A few years ago (green lines), there was a double hump in the curve, suggesting two popular price bands. Over the intervening three years, the bands had merged into what amounts to a broad range of prices, although this year we see the double peak appear again.
- The width of the curve under the peak has widened, suggesting that the spread of the popular price bands is increasing.
- The height of the curve has increased at the same time, illustrating that we are seeing an increase in the total number of fully OA journals. The curve to the right of the peak is becoming shallower, which – as with hybrid journals – will have the effect of increasing average prices paid.
(Note: the chart does not show journals without APC. Subscribers can filter the chart options to include these journals in a chart.)
Conclusion
While headline and outlying price changes are important general indicators, they do not necessarily shift the market on their own. Changes in the spread and emphasis of popular price bands play a key role too. It is the aggregate effect of these changes, as illustrated in the figures above, that enables a better understanding of how the market is shifting.
We are seeing an increasing spread of popular price bands. These are skewed slightly to the higher end of the pricing spectrum, and average prices paid will continue to increase.
As we explored at length in our analysis “APC Price Changes – When does up mean down?”, average headline price rises can lead to falling overall spend or vice versa, depending on the numbers of papers published and spread of price increases across a portfolio.
Per-APC information is useful in a wider context too. Even where deals are calculated based on bundles, they are often set by discounting from list APCs – especially where publication activity exceeds agreed caps. Similarly, understanding revenues generated per paper is important to calculate thresholds for journal flips or for launching and sustaining a Subscribe to Open (S2O) model.
Studying individual journal list APCs remains foundational for understanding pricing across all OA business models.
This article is © 2023 Delta Think, Inc. It is published under a Creative Commons Attribution-NonCommercial 4.0 International License. Please do get in touch if you want to use it in other contexts – we’re usually pretty accommodating.