News & Views: Market Sizing Update 2023

Dan Pollock and Ann Michael • October 24, 2023

Overview


Each year, Delta Think's Market Sizing analyzes the value of the OA scholarly journals market. This is the revenue generated by providers or the costs incurred by buyers of content.


We estimate the OA segment of the market to have grown to just over $2bn in 2022. This is strong growth over the previous year, although it is significantly lower than the year before. The overall scholarly journals market showed very little growth during the same period.


The headlines suggest that we may be seeing the beginnings of a correction to long-term trends after two years of exceptional growth in the wake of COVID-19. However, reductions in growth rates are exaggerated by currency effects.


It is too soon to know exactly when we may see a return to long-term trends. Our models currently suggest a further correction through 2023 and possibly 2024.


Headline findings


Our models suggest the following headlines for open access market sizing:

We estimate that the OA market grew to just over $2bn in 2022.

  • 2022’s OA market grew by a little over 24% from 2021. This is around two thirds of the growth we saw in 2021.
  • We estimate the total scholarly journals market to have increased by 0.4% in 2022, compared with its long-term low single-digit growth of 2%-4%.
  • Given the exceptionally high growth in 2020 and 2021, a correction in 2022 was expected. We saw this in the whole market. It is less obvious in the OA segment as its growth remains strong; however, OA’s growth was significantly lower than it had been previously.
  • Growth in hybrid revenues was a major factor driving growth in OA, although all types of OA saw improved revenues per article, which helped to drive growth.
  • Currency effects contributed to reduced growth. Many publishers operate in non-USD currencies, which lost value against the US dollar in 2022. If we exclude currency changes, the OA market would have grown by over 29% (an additional 5 points) in 2022, and the overall journals market would have grown at 3.6% (around 8x its headline growth). This suggests that underlying growth in the OA market has slowed slightly, and that of the overall market is growing in line with long-term trends.
  • Growth in OA remains significantly above that of the underlying scholarly journals market.
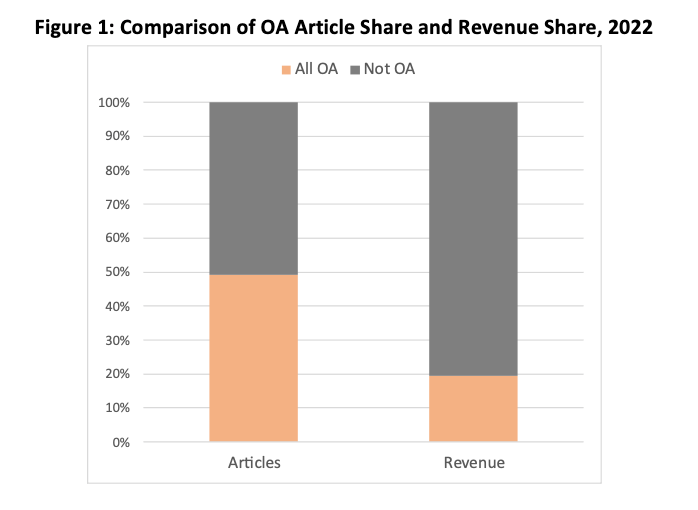
  • Just over 49% of all scholarly articles were published as paid-for open access in 2022, accounting for just under 20% of the total journal publishing market value.
  • We anticipate a 2022-2025 CAGR (average growth each year) of 13% in OA output and 13% in OA market value.


A note about our method


As ever, we are very grateful to the organizations that participate in our annual survey, which we anonymize and aggregate to inform our estimates. We will be sending out our usual detailed market update and analysis to participants shortly.


Our market estimates focus on research publications for which money is likely to be paid, either to read or to publish. We focus on underlying trends to inform strategic decision-making. Open Access in this context excludes “Bronze” (public access) and Green OA. Each year our data improves, so we restate figures as needed to keep them up to date1.


Trends


We have seen a slow-down in growth in 2022, although underlying drivers of the market remain strong.

  • COVID-19 led to a significant increase in publishing activity, showing above-average volumes and growth rates in 2020 and 2021.
  • Last year, results from our survey and anecdotal feedback gave mixed messages about the outlook for 2022. Low growth in 2022 was expected by many, as things corrected towards underlying trends. 2022 did show markedly lower growth compared with the previous year. However, as the underlying growth of OA remains strong, 2022’s lower growth numbers seem high when taken in isolation.
  • Our anecdotal evidence and our publisher survey lead us to expect a further slowing of growth in 2023, as activities normalize back to underlying trends through 2023 and 2024. It is too soon to say by exactly how much and when this will happen.
  • Slowing growth in OA output contributed to its reduced growth. Fully OA output grew at around half the rate of hybrid output. However, growth in OA revenues was greater than growth in output. This suggests that OA “yields” – revenues per article – improved. Hybrid showed the best performance – its value grew almost twice as much as that of fully OA.
  • We noted last year that OA has systemically accelerated in recent years, and we think the fundamental drivers behind this remain. Publishers continue to focus on OA in the wake of various policy announcements.
  • Prices have increased, and we anticipate that this will continue, although the effects of mixed-model deals on pricing dynamics have yet to become clear. Hybrid revenues realized per article published remain higher than those published in fully OA journals, and we expect this trend to continue.
  • OA is increasingly delivered as part of mixed-model deals, combining read and publish elements. This may impact OA’s share of revenue in the market in the future depending upon how publishers apportion revenue from those deals to OA.
  • In 2022, 49% of output was OA, accounting for just over 20% of its value. This means that on average less money changes hands for OA articles than for non-OA ones. However, OA’s share of revenue is rising proportionately faster than share of volume, so this gap continues to narrow.


Conclusion


2022 was preceded by two years of exceptional growth in open access activity and value. We saw the beginnings of a correction to offset this in 2022. The overall scholarly journals market remained flat, and growth in OA in 2022 – while strong – fell to two thirds of its previous high.


Last year, we questioned whether things would fall back quickly or slowly. They appear to have done both. The headline numbers show a significant reduction of growth compared with previous years, although the strong growth in OA masks this. When the effects of currency variations are removed, reductions in growth rates look softer – growth in OA moves from 24% to 29% (a 5-point increase), and the overall market comes back to normal growth rates.


We are likely still witnessing the effects of disruption in the wake of COVID. However, it is too soon to tell when the reduced growth rate will return to normal, and whether the 2022 figures will alter long-term trends. Our anecdotal feedback and our publisher survey suggest a reasonably positive outlook for 2023 – although not for everyone – and several factors will influence the results.


If exchange rates swing back from 2022 levels, then they could boost growth in 2023 in the same way they reduced it in 2022.

The increasing use of mixed-model deals brings with it reporting issues. Our methodology includes steps to isolate and model just the publish part of these deals when estimating OA value. As OA becomes an increasingly large part of revenues, we anticipate that higher proportions of revenue will be apportioned to OA when organizations report their figures, as they wish to best reflect the balance of their operations. Such reclassification may in turn lead to an apparent growth in OA value.


Finally, OA’s share of value (just under 20% in 2022) has always lagged behind its share of output (just over 49% in 2022). If this were to continue, then the overall value of the market will reduce as more OA is adopted. However, the gap is narrowing. In 2022, as in previous years, we saw the value of OA grow faster than its output, suggesting that yields from OA articles continue to increase. This is a critical dynamic if the value of the market is to be maintained. While publishers have been actively pursuing activities that diversify revenue and manage costs for years, their efforts to maintain value remain critical.

Our industry does not systematically report comprehensive data about market volumes or value. So, any market sizing is an approximation, and figures should be taken as approximate. Subscribers to our Data & Analytics Tool can drill into the numbers in much greater depth, including analyzing society-specific output and subscription output. Please get in touch if you want to know more.


1As our survey coverage improves, we recalculated our estimates for 2021 market values. Of particular interest in this context, we revised our estimate of the total 2021 OA market from $1.60bn to $1.65bn. Please note that market estimates by their very nature are not exact.


This article is © 2023 Delta Think, Inc. It is published under a Creative Commons Attribution-NonCommercial 4.0 International License. Please do get in touch if you want to use it in other contexts – we’re usually pretty accommodating.


By Dan Pollock & Heather Staines February 10, 2026
This edition of News & Views looks at the changing patterns of license use over time. Are licenses becoming more or less permissive and what are the implications for scholarly publishers? Introduction Last month we compared the patterns of license use as reported by the members of the Open Access Scholarly Publishers Association (OASPA) with those observed in the wider scholarly journals market. Our comparison looked at the aggregated total numbers of licenses during the years 2015-2024. This showed a useful snapshot of the complete 10-year period spanned by the data. But how has the use of license types changed over that time? This month we dive into the temporal changes, focusing on the core scholarly journals market based on data in our Data and Analytics Tool (DAT). DAT allows for multiple comparisons and in-depth analysis, and, in this edition of News & Views, we highlight a couple of interesting examples of trends over time. The different types of OA licenses We start by focusing on only Open Access (OA) journal output. Many funders and institutions mandating OA also insist on certain OA license types, typically more permissive CC0 or CC BY licenses (to be consistent with the foundational Budapest Open Access Initiative ). However, more restricted licenses, such as those prohibiting commercial or derivative use, are also broadly used. For the purposes of our analysis, we define these as follows. “Permissive” refers to articles published under CC0 or CC BY licenses. These are the ones defined as required by major OA advocates, such as Plan S , Wellcome , HHMI , etc. “Restricted” refers to articles published under other licenses that allow limited reuse, such as CC BY-NC (non-commercial), CC BY-ND (no derivatives), or publisher-specific licenses. Although not conforming to the strictest OA mandates, such licenses are widely used and are consistent with many mandated OA requirements. Publishers sometimes charge lower APCs for these more restrictive licenses compared with their permissive counterparts. Data comparing the use of permissive vs. restricted licenses in open access output is shown below.
By Lori Carlin & Bonnie Gruber January 29, 2026
Building on last Spring’s survey of authors and researchers, we are once again analyzing responses from a large, global community to understand how shifts in the funding and policy environment are affecting research activity, priorities, and outlook. Conducted in partnership with 32 organizations, the Second edition of our Author–Researcher Survey was designed explicitly as a continuation of the work conducted in Spring 2025, allowing us to again take the pulse of authors-researchers, track emerging trends, and identify early signals related to real and perceived changes in U.S. science policy and research funding. With 12,122 completed responses from researchers in 125 countries , the Second survey again provides a robust and diverse dataset. Analysis is ongoing and the high-level structure of the respondent pool is already clear, closely mirroring, while subtly extending, what we observed in the Spring of 2025. A Global Community, with the U.S. at the Center of the Conversation The most recent respondent pool again reflects a truly global research community. Just over half of respondents are based in the United States, with others reporting from a broad range of countries worldwide. This near-even U.S./international split remains one of the defining features of the dataset and is particularly important given the survey’s focus on U.S. policy and funding dynamics. The results continue to underscore that changes originating in the U.S. research system are global in scope, closely watched and widely felt well beyond national borders. Science-Heavy Participation Anchored in Physical, Life, and Health Research Physical sciences represent the largest single area of engagement, alongside strong representation from the life sciences, health sciences, and engineering and technology. Social sciences and the arts and humanities account for a smaller share of responses, and as in prior responses, many participants report working across multiple fields. This pattern reflects both the interdisciplinary reality of modern research and the continuity needed to support meaningful year-over-year analysis. Insights Shaped Largely by Mid- and Senior-Career Researchers Mid- and senior-career respondents make up the majority of the sample, complemented by a substantial cohort of early-career researchers and representation from graduate and doctoral trainees. This reinforces that much of the insight emerging from the survey reflects the perspectives of researchers with long-term experience navigating funding cycles, institutional change, and strategic research planning. That experience is also evident in respondents’ professional roles. Faculty members and principal investigators account for the largest share of participants, alongside researchers, analysts, postdoctoral fellows, and graduate students. Clinically active professionals—including physicians and other healthcare providers—are also represented. The overall role mix remains highly consistent as compared to the Spring group, strengthening confidence that shifts observed in attitudes or behavior are not driven by changes in who is responding. Why This Continuity Matters One of the most important features of this current dataset is how closely its underlying demographic structure aligns with the Spring survey results. This consistency strengthens our ability to interpret changes in sentiment, expectations, and reported actions as genuine signals rather than artifacts of sampling. The scale and international reach of the most recent responses allow us to surface new nuances, particularly around how researchers are adapting to evolving policy signals, funding uncertainty, and institutional responses. What Comes Next We are digging into the full results to explore how researchers’ outlooks have evolved, including: Whether perceptions of funding stability and risk are shifting How researchers are adjusting research scope, timelines, or collaboration strategies Persistent signals related to mobility, field-level vulnerability, and longer-term confidence in the research enterprise Decisions about research funding, policy, and scholarly communication increasingly require evidence, not assumptions. Delta Think’s research process is designed to provide the scholarly communication community with the rigor, scale, and transparency needed to build sustainable strategies in an uncertain environment. From survey design through analysis and reporting, our approach emphasizes methodological consistency, careful segmentation, and openness about what the data can support. By maintaining continuity year over year, we aim to surface credible trendlines that stakeholders across the research ecosystem can trust. The Delta Think team designed this initiative to gather data and to support our partners across the scholarly ecosystem. By combining rigorous research design with deep industry context, we help publishers, societies, and institutions make informed, strategic decisions during periods of significant change. If you’re interested in learning more about the findings or discussing how they apply to your organization, we’d welcome the conversation. Please email Lori Carlin to get started.
By Dan Pollock & Heather Staines January 13, 2026
Overview This month we look at the changing mix of licenses in use among OASPA members and what these trends reveal for open access publishing more broadly. Introduction Each year OASPA surveys its member organizations to gather information about the volumes of output they publish in their fully OA and hybrid journals. These data provide a useful lens on how the most OA-committed publishers are approaching licensing and how that compares with the market as a whole. We’re delighted to be working with OASPA on its survey again this year. We process the raw data into consistent categories, normalize publisher names, and create visualizations of the data over time. We also produce a yearly blog post in cooperation with OASPA, outlining some of their results. Because space constraints limit what can be covered in OASPA’s own post, we explore additional angles here, placing OASPA member behavior in the context of Delta Think’s wider, market-level analysis. Subscribers to our Data and Analytics Tool can investigate the data further still. Our work with OASPA provides a complementary view into our market-wide analysis. Use of Licenses We can examine which common open access licenses are in use, as follows. 
By Lori Carlin December 4, 2025
Impelsys and Delta Think Join Forces to Expand Strategy and Technology Capabilities for Publishing, Scholarly Communications, Education, and Healthcare Communities
By Dan Pollock and Heather Staines December 2, 2025
Overview Each year, our scholarly market sizing update and analysis goes way beyond open access headlines. One consistent finding is that market share of open and subscription access is highly dependent on subject area. This month we look at how to best use our Delta Think Data and Analytics Tool (DAT) to understand and analyze these variations. With coverage of approximately 220 detailed subject areas, the data shows that headlines can sometimes mask important detail. Background Since we began our scholarly journal market analyses in 2017, one of our core objectives has been to enable deep analysis of our headline findings. Our annual market share updates represent a summing of data – more than 200 detailed subject areas, 200 or so countries, also split by society vs. non-society journal ownership. This level of detail is clearly too much for our monthly short-form analyses, so we present the market-wide headlines in our annual updates. However, by picking one subject area as an example, we can see how much nuance lies beneath the surface, and why these variations matter. Subscribers to DAT can use our interactive tools to quickly and easily see each level of detail and filter for just those relevant to their organization. Market Share Variation by Subject Area Our latest market headlines suggested that open access (OA) accounted for just under 50% of article output in 2024. However, this headline proportion varies considerably by subject area.
By Lori Carlin & Meg White November 19, 2025
Navigating Uncertainty, Innovation, and the Winds of Change As the Charleston Conference 2025 wrapped up, one thing was clear: scholarly communication continues to evolve against a backdrop of uncertainty: economic, technological, and policy-driven. Yet amid the turbulence, conversations throughout the week pointed toward resilience, adaptability, and even optimism. As Tony Hobbs observed during the Shifting Tides policy session, “the good news for scholarly communication is that due to technology advances, it is now possible to sail into the wind.” The Elephant in the Room: Doing More with Less Heather Staines Every conversation I had in Charleston seemed to circle back to one thing: budgetary uncertainty. Whether the concern was policy changes like potential caps on overhead or shifting grant funding or the ripple effects of declining enrollment, both domestic and international, everyone was asking how to do more with fewer resources. This theme ran through the plenary Leading in a Time of Crisis, Reclaiming the Library Narrative, and even the lightning sessions, a shared recognition that we’re all trying to redefine what “enough” looks like. What stood out was how data-driven decision-making has become essential. Libraries, publishers, and service providers are not just analyzing what to add, but what to let go of, all in an effort to find a new balance. And then there’s AI. We have moved beyond “sessions about AI” to “AI everywhere.” I will admit that I once thought AI was a solution in search of a problem, but now it’s woven through nearly every conversation. Librarians are leading the way on AI literacy, while publishers and service providers are using AI to innovate to meet changing research needs. The uncertainty is real but so is the shared determination to adapt, learn, and move forward together. The Long Arm of the Law and Its Reach into Scholarly Communication Meg White One of the things I love about Charleston is that there is always a moment that challenges me to reframe how I think about the work we do. This year’s Long Arm of the Law session did exactly that. It was a vivid reminder that the legal and policy currents swirling around us are not abstractions; they shape our ecosystem in ways we can’t afford to ignore. Paul Rosenzweig set the stage with a fascinating and lively walk through the history of executive orders. Hearing that Washington issued just eight while later presidents relied on them more frequently primarily to advance political agendas made the evolution very real. What stood out was the fine line between legitimate executive authority and overreach, and how easily those boundaries can blur. Nancy Weiss then brought the conversation directly into our lane with her analysis of an Executive Order directing the Institute of Museum and Library Services (IMLS) to reduce its activities to the bare legal minimum. Her experience as former General Counsel gave us an inside view of what such a directive could mean for libraries, museums, and cultural programs, all places where so much of our community’s work takes root. Sessions like this are why Charleston continues to be invaluable to me. They stretch my understanding, give me new context, and remind me that staying informed is part of how we navigate change together. Data-Driven Insights: The 2025 Author and Researcher Survey Lori Carlin My week was cut unusually short (for me) by other meetings I had to fly off to, but I still managed to squeeze in 2.5 days of interesting sessions, discussions, and ‘business casual’ gatherings. The first two events I attended this year were definite highlights, both of which were the brainchild of and brilliantly orchestrated by my colleague, Heather Staines – the Vendor Meetup on Monday evening and the Leadership Breakfast on Tuesday morning. Both were jam packed and filled with lively conversation. If you’re not familiar, the Vendor Meetup is an open, casual gathering (sponsored this year by Get FTR) designed to give vendor representatives, especially early career attendees, who attend only for Vendor Day a chance to socialize and network, something they often miss when they’re in and out in a single day, but all are welcome to attend! The Leadership Breakfast, a smaller invitation-only event designed to give a more intimate networking experience within the larger Charleston Conference, is always a thoughtful session centered on a pressing issue of the day, and this year was no exception. The discussion focused on sustainability across the entire scholarly communication ecosystem—from funders to libraries to publishers. Frankly, no one can unhear the words of one of the panelists (a library director) when he commented that his budget has dropped from ~$7M to ~$5.4M in the last 24 months … with more to come. Finally, I’m a little biased, but I dare say I and my panelists were very pleased with the session I moderated focused on the impact of US research funding changes, which highlighted info from Delta Think’s Spring 2025 Author and Researcher Survey, along with how publishers who participated used the data to inform their strategies. We also had a librarian on the panel who informed the audience about the impact of these changes on universities overall and libraries in particular. As you may know, the survey data showed rising concern about institutional support, with many researchers rethinking how they publish and participate in conferences. Respondents also described how tightening budgets are straining peer review and research dissemination, while responses varied sharply between U.S.-based and international authors, reflecting distinct policy and institutional pressures, it also showed that the impact is being felt globally. In the tradition of Charleston, what made the session so powerful was the discussion. Colleagues from societies, publishers, and libraries focused on how they are using these insights to understand the challenges and to act on them. From adjusting publishing strategies to helping researchers to growing relationships in other markets, to shaping advocacy and outreach activities, organizations are using these insights to inform resource and budget direction in innovative ways. For me, that was the real takeaway: turning evidence into collaboration, and progress. Even in uncertain times. We’re running the survey again now with plans to compare results to the Spring version. If you’re interested, there is still time to sign up! End of An Era (Two, in Fact!) This year’s conference marked a pivotal moment: the first without the in-person presence of founder, Katina Strauch (though we were grateful for her virtual participation), and the well-earned retirement of longtime Conference Director Anthony Watkinson, who rang his iconic bell one last time. We would not be here without them and their visionary colleagues who built this community from the ground up. Thank you, Katina and Anthony. Charting What Comes Next If there was one metaphor that captured Charleston 2025, it was motion; not adrift, but deliberate progress in the face of resistance. From policy updates to AI integration to the enduring strength of the scholarly community, the week’s sessions affirmed that innovation often takes root during uncertainty. As Tony Hobbs reminded us, even headwinds can propel us forward — if we learn how to adjust our sails.
By Heather Staines November 6, 2025
We are proud to share a video recording of our October News & Views companion online discussion forum! Join us for our annual update on the volume and revenue associated with Open Access publishing. If you missed the session, or if you attended and would like to watch/listen again, or share forward with friends, please feel free!
By Dan Pollock and Heather Staines October 21, 2025
Overview After a rocky couple of years, the open access (OA) market may be finding its footing again. Each year, Delta Think's Market Sizing analyzes the value of the OA scholarly journals market—that is, the revenue generated by providers or the costs incurred by buyers of content. Our analysis estimates that the OA segment expanded to just under $2.4bn in 2024. Although growth has improved compared with last year’s deceleration, it continues to lag behind the broader historical trend for OA. The proportion of articles published as OA has declined slightly, likely driven by continued reduction in the output from the large OA publishers. This trend has benefited established publishers, who saw growth in OA activity and revenue as they continued to consolidate their positions. Looking ahead, OA could soon begin outpacing the broader journals market once again—but likely through different growth drivers than in the past. Read on to see what those shifts might look like. Headline findings Our models suggest the following headlines for the 2024 open access market:
By Lori Carlin & Meg White October 13, 2025
Collaborate with Delta Think to uncover how funding and policy uncertainty continue to reshape the research ecosystem — and gain tailored insights for your community.
By Lori Carlin & Meg White September 25, 2025
Introduction: One question, two paths  A recent essay in The Conversation posed the question, “Is ChatGPT making us stupid?” The author examined emerging research suggesting that over-reliance on AI tools for writing can dull critical thinking, originality, and even memory retention. But as the author points out, AI has the potential to augment human intelligence when used well , acting as a catalyst for deeper thinking rather than a shortcut around it. We agree and seek to guide our clients in determining how to use AI to strengthen research and scholarship. From concern to opportunity When AI is approached as a collaborator, it sparks creativity, deepens inquiry, accelerates problem-solving, and amplifies creativity. It can strengthen teams, enhance services, and improve efficiencies across the publishing enterprise. Turning Ideas into Action Here’s how Delta Think can help you transform smart AI potential into purposeful, strategic action: Strategy and Market Research Focus: Identify where AI can deliver the most value for your organization, grounded in community needs and behaviors. Delta Think Approach: Gather and analyze evidence through quantitative and qualitative methods to uncover how your community – your researchers, authors, reviewers, and readers – are using AI now or, better yet, where and how they could be using it in the future. Marrying their unmet needs with your strategic goals creates your roadmap to future success. 2. Build vs. Buy Decisions for AI-Powered Products Focus: Develop proprietary AI solutions, partner with trusted vendors, or combine the best of both approaches to suit your needs. Delta Think Approach: Assess your current state and future needs, design decision frameworks that weigh cost, capability, risk, speed-to-market, and long-term scalability, and build the approach that will work best to support your business goals and community needs. 3. AI Policy and Governance Focus: Ensure responsible, transparent, and ethical AI use that safeguards scholarly integrity. Delta Think Approach: Facilitate the development of your AI governance with the creation of important guardrails and policies, working to mitigate bias and hallucination risks, safeguarding research integrity while enabling innovation. 4. UX/UI Testing for AI Products and Features Focus: Design AI experiences that enhance human engagement. Delta Think Approach: Test results, interfaces, prompts, and transparency signals to keep users informed, empowered, and confident in your products and tools. 5. Licensing and Partnership Strategy Focus: Leverage commercial arrangements to unlock AI potential while aligning with your mission and values. Delta Think Approach: Guide you through licensing agreements, proprietary data partnerships, and collaborations that create sustainable competitive advantage and strategic revenue streams. Turning Ideas into Impact By reframing the conversation from Can AI substitute scholarship? to How does AI amplify scholarship? , publishers can lead the next wave of innovation. Delta Think’s collaborative approach ensures that your organization’s adoption of AI enhances creativity, critical thinking, and trust. We can help you map out your bespoke AI-strategy roadmap, develop new products and services, test prototypes, and design governance guidelines. Reach out today or schedule some time at the Frankfurt Book Fair (10/14-16) to discuss how Delta Think’s expertise and proven methodologies can help your organization unlock key insights and drive innovation.