News & Views: Open Access Books – Part II

Last month we looked at the growth of OA Books from the perspective of the activity in the DOAB index. This month we look at them from the publishing perspective to understand how backlist compares with frontlist, how books compare with journals, and the subject coverage in OA Books.
Background
Most books will make the bulk of their revenues in the few months following publication. Although this is not always true, the separation of books into a frontlist (“this year’s books”) and backlist (“books from all previous years”) is common practice amongst book publishers. It will be interesting to follow new models where the backlist is monetized to support an OA frontlist to see what impact this has on the opening of older titles.
Analyzing when books were deposited in an index like Directory of Open Access Books (DOAB) – as we did last month– shows us how the index is growing and how publishers are increasingly engaged with OA books. But, if a publisher decides to implement an OA books program, what does it do with older titles? Does it make its backlist retrospectively OA? Or reserve OA for frontlist titles only? (Or both?)
Frontlist vs Backlist Activity
By comparing the year a book was published with the year it was indexed (added to the DOAB), we can see to what degree books have been retroactively made OA. Figure 1 shows the results across the whole DOAB.
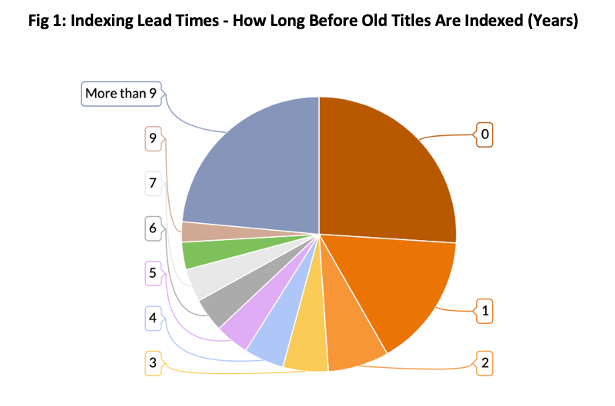
Source: Directory of Open Access Books (DOAB), Delta Think Analysis. © 2021 Delta Think, Inc. All rights reserved. May not be reused without permission.
The chart above analyzes the lead times in indexing books. It shows how many years after publication books were added to the index (the DOAB) and deemed to be made OA.
- If titles are made OA in their year of publication (deemed to be frontlist titles), the lead time will be zero. Just over 25% of DOAB titles are frontlist.
- If titles were made OA after their year of publication (deemed to be backlist titles), then the lead time will be a positive number. Around 16% of titles were made OA the year after publication. The remaining 69% or so of titles are deep backlist.
- Although not shown above, the oldest titles in the DOAB date back decades. Earlier years (before 2000) typically have a handful of titles per publication year, with annual numbers increasing significantly in more recent years. The oldest title in the index was published in 17871.
Analyzing the data by publication year reveals different – and more consistent – patterns over time, as shown in Figure 2.
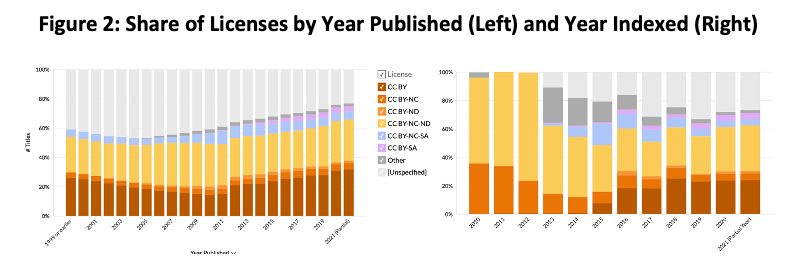
Source: Directory of Open Access Books (DOAB), Delta Think Analysis. © 2021 Delta Think, Inc. All rights reserved. May not be reused without permission.
The same colors are used in both charts above to represent different licenses. The charts cover different time periods; both show one bar per year. The details are deliberately small as the charts above are only meant to illustrate one thing: Patterns in license usage are different if analyzed by publication year (left) compared with the year they were made OA or added to the index (right). We can clearly see license use by publication year shows distinct patterns, but license use by indexed year appears more random.
Licenses – Comparison with Journals
The modern Open Access movement started with journals. Books and monographs present their own challenges. Figure 3, below, compares the two worlds.
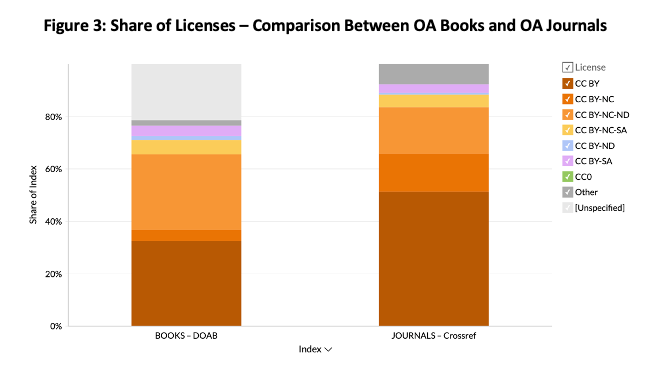
Sources: Directory of Open Access Books (DOAB), Crossref, Unpaywall, Delta Think Analysis. © 2021 Delta Think, Inc. All rights reserved. May not be reused without permission.
The figure above shows the shares of various indexes’ open access content accounted for by various licenses.
- The high prevalence of Creative Commons licenses is common to both OA books and OA journals.
- The high degree of “unspecified” licenses for DOAB (books) is a facet of the data. It perhaps reflects that books infrastructure is less mature than that for journals.
- We can compare shares of book titles in the DOAB (the left-most bar) with the shares of articles in journals listed in Crossref.
- We see that the proportion of CC BY licenses (colors at the bottom of each bar) is significantly lower in books (32%) than in journals (51%). Likewise, CC BY-NC (2nd from bottom) – books (4%) vs. journal articles (15%). But CC BY-NC-ND licenses show the opposite: books have a greater proportion (29%) than journals (18%).
- The differences remain even if we exclude unspecified licenses.
Subject Coverage
Anecdotally, the received wisdom is that OA books lean more towards arts, humanities, and social sciences compared with journals. Figure 4, below, examines OA books coverage by subject.
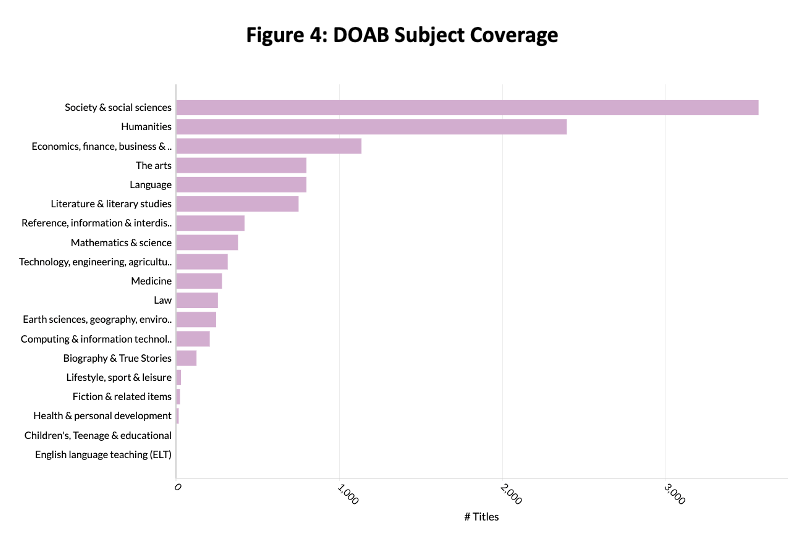
Source: Directory of Open Access Books (DOAB), Delta Think Analysis. © 2021 Delta Think, Inc. All rights reserved. May not be reused without permission.
The figure above looks at relative numbers of titles in the DOAB broken down by major subject area.
- The DOAB is transitioning to using Book Industry Communication (BIC) categories to index its subject coverage. As of July 2021, around 50% of the index has BIC categories specified.
- Arts, Humanities, and Social Sciences make up the lion’s share of the index. Around one fifth of OA books are in the sciences, compared with 90% of open access journal articles.
- Subscribers to our Open Access Data and Analytics Tool can see how subjects change over time by both indexed year and publication year. Subject coverage has changed markedly over time.
Conclusion
Compared with journals, we can see that OA books follow their own distinct patterns. Books use more restrictive licenses, especially amongst major publishers. They show a complimentary coverage of subjects: 20% of book titles cover STEM compared with 90% of journal articles. Although not covered here, publishers’ market share is different too.
As publishers implement OA books programs, it is highly likely that they will retrospectively add books. Analyzing the indexes of OA books is a measure of activity, but it only shows when publishers made books OA or when they chose to deposit their metadata. So it is important to analyze OA books data by publication year. In the less mature world of OA book infrastructure, this is particularly important compared with simply looking at the activity in book indexes.
For the sake of brevity, we have only scratched the surface here. Licenses, subject coverage, and languages show distinct patterns that depend on the year of publication. Different languages are more prevalent among older titles compared with more recently published ones. Likewise, older titles are dominated by different subjects to newer ones.
Subscribers to our Open Access Data and Analytics Tool can explore the data in detail. Meanwhile, we hope our brief analysis here is useful to all.
1 Since you ask: Die Mitschuldigen (Ein Lustspiel) [The Accomplices – a comedy] by Johann Wolfgang von Goethe
This article is © 2021 Delta Think, Inc. It is published under a Creative Commons Attribution-NonCommercial 4.0 International License. Please do get in touch if you want to use it in other contexts – we’re usually pretty accommodating.