News & Views: Open Access Books – Part I

Dan Pollock and Ann Michael • July 20, 2021

This month we look at the growth of Open Access Books. We look at some key statistics from the Directory of Open Access Books (DOAB) and examine the rapid growth in OA Books.


Background


The Directory of Open Access Books (DOAB) was originally developed in 2012. It is one of three platforms run by the Netherlands-based OAPEN Foundation and France’s OpenEdition. OAPEN provides infrastructure for OA books and promotes their awareness and discovery. It was originally an EU-funded project and became a foundation in 2010.


OAPEN’s other two platforms include the OAPEN Library OA book repository, and the OAPEN Open Access Books Toolkit for authors. The DOAB covers a superset of books in the OAPEN Library, so we use its data for the most comprehensive coverage. The DOAB focuses on academic books, which must be made available under an open access license and be subjected to independent and external peer review prior to publication.


Growth of the DOAB


We first analyzed the total number of titles in the DOAB and their licenses, as shown in Figure 1, below. Figures for 2021 are YTD to end of June 2021; all other numbers are full year.

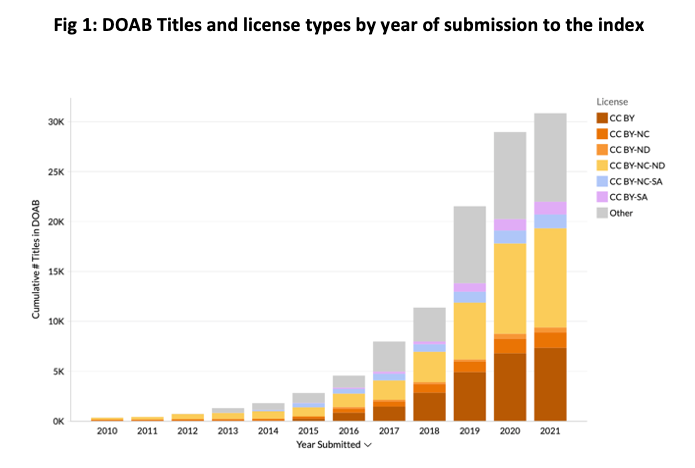
Source: DOAB, Delta Think Analysis.


We can see that the DOAB now indexes over 30,000 titles.

  • The charts show the cumulative number of titles growing over time.
  • License proportions are largely consistent over time.
  • Just over 71% of titles use CC licenses.
  • CC BY-NC-ND licenses are the most common (32% of the index).
  • CC BY licenses are the second-most common (24% of the index).
  • The numbers above do not include the circa 5,000 titles with submission dates unspecified in the publicly available data. (At the time of writing – July 2021 – the team at the DOAB are working on a fix.) We have excluded these titles from the chart above. Subscribers to our OA Data and Analytics Tool will be able to see the updated figures when they are released by the DOAB.
  • Submissions for 2010 and 2011 were imported from an OAPEN service set up in 2010.


Make-up of the DOAB


The overall proportions of licenses in use by the index remain fairly constant over time. However, within the averages we see some interesting things depending on language and publisher.

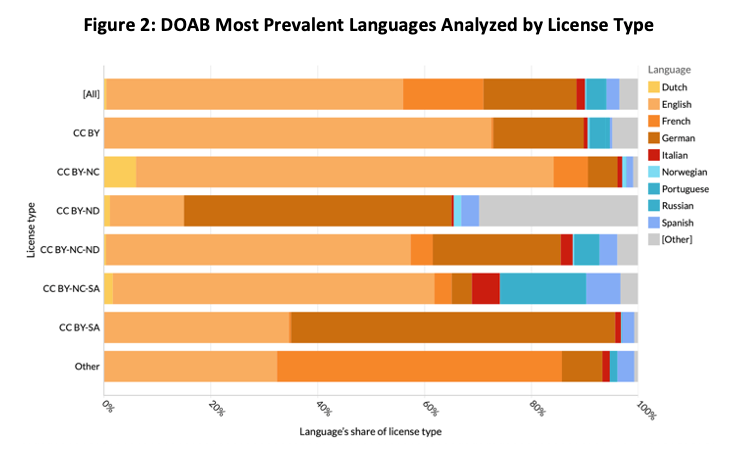
The figure above shows how the different languages making up the index relate to license types. Each horizontal bar represents a license. The colors show how the titles under each license are split between languages.

  • Overall (the top bar), English is the most common language covering 55.5% of the index with German second (17.4%) and French third (15%). The remaining 12.1% of titles are split between around 40 languages in total. The most prevalent licenses are shown above; the rest form a long tail.
  • English accounts for 72.6% of CC BY and 78.2% of CC BY-NC licensed books.
  • Compare this with German, which accounts for 60.7% of CC BY-SA and 50.1% of CC BY-ND.
  • French covers the largest share (53.3%) of non-CC or unspecified licenses.


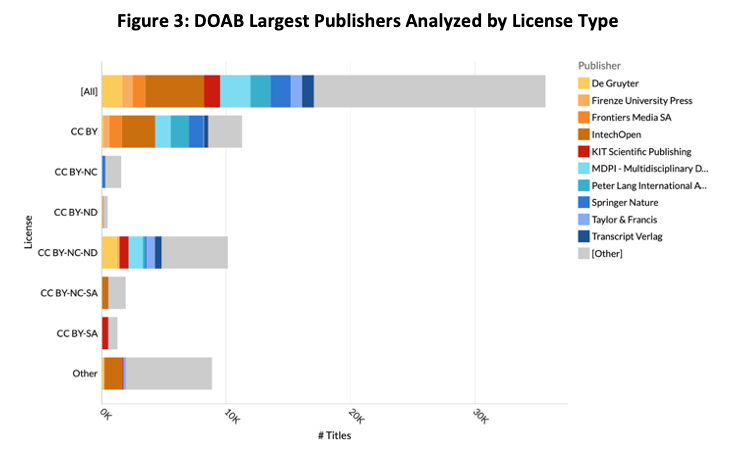
The figure above looks at how the largest publishers contribute to the index, and their preferred licenses. Each horizontal bar represents a license. The colors show how the titles under each license are split between publishers. The length of the bars show the total # titles in the index, so you can see the relative weight of each.

  • The 10 largest publishers together account 47.9% of the index (top bar). Another 460 or so publishers make up the remaining 52.1% of the titles.
  • The largest publishers are now IntechOpen (13.2% of titles), MDPI (6.8%), then de Gruyter, Peter Lang and Springer Nature (ranging from 4.7% to 4.5%).


Most publishers favor CC BY or CC BY-NC-ND licenses. CC BY is the most common for the majority. However, note that MDPI publishes more under NC-ND than BY.The underlying data (not shown here) reveal historical patterns in publishers’ growth. 2019’s figures were boosted by IntechOpen, KIT Scientific, and Peter Lang International adding significant numbers of titles. Before 2015, the current top 10 publishers accounted for only around 10% of the index.


Conclusion


The DOAB has seen explosive growth over the last few years. Over the 3 years to 2020, its CAGR was 53%, compared with 14% for OA journal articles. (5-year CAGRs to 2020 are 60% for the DOAB and 15% for journals).


Although some of this is likely a result of the infrastructure becoming more widely adopted, it’s clear that OA books are gaining traction. Growth is driven by larger organizations coming on board, plus a growing long tail of publishers joining OAPEN. The likes of Springer Nature, De Gruyter, KIT, and T&F have been longstanding contributors to the index.

The explosive growth of books should also be put in the context of “high growth from a low starting point”. Absent a definitive index of academic books, we sampled data from a few publishers. The results suggest that barely 1% of their output is in the DOAB on average. So, as with journal article output, we may see growth rates start to fall towards a steady state after the initial cohort of titles is made open.


Comparing patterns in books with those in journals shows that there is a similar level of consolidation in the market. The 10 largest publishers account for around 50% of both books and journal output. License usage, however, appears to be different for books: CC BY-NC-ND appears to be far more prevalent in books compared with journals. Books are different beasts to journals, so it’s likely that authors and publishers want greater restrictions intended to “protect” long form scholarship, which is so central to tenure and promotion in Humanities and Social Sciences and also to afford greater commercial opportunities around print and other formats.


With so many unknowns in the current data set we will need to wait for updates to complete a full analysis. We will run further analysis as more data becomes available to us.


This article is © 2021 Delta Think, Inc. It is published under a Creative Commons Attribution-NonCommercial 4.0 International License. Please do get in touch if you want to use it in other contexts – we’re usually pretty accommodating.

By Dan Pollock and Heather Staines April 22, 2025
In March 2025, we looked at the latest Article Processing Charges (APCs) . This month we focus on how prices have risen relative to inflation. As APC price increases fall back to trend, what does this mean in real terms? Background Each year we survey the list Article Processing Charges (APCs) of more than 30 major and significant publishers. Going back to 2015, the dataset includes more than 20,000 unique titles and 150,000 title per year combinations. Going into 2025, we saw price increases fall back to long-term trends from their unusually high increases in 2024. Fully OA (“gold”) journal list prices across our sample rose by around 6.5%, compared with a 9.5% increase this time last year. Hybrid list prices rose by an average of 3%, compared with 4.2%. Last year’s price rises were above long term trends, but overall we found they were rising below inflation. How does this hold for this year’s price increases? We again use the global Consumer Price Index (CPI) as our inflation index, as we consider it to represent the most realistic view of our marketplace. Prices exclude zero APCs, so we can see the effects for instances when publishers choose to charge APCs. Are APCs becoming cheaper or more expensive? The chart below shows how increases in all list APCs work out in real terms for both hybrid and fully OA journals.
By Heather Staines April 7, 2025
We are proud to share a video recording of our March News & Views companion online discussion forum! Join us to hear the latest trends around APC data, including APCs for both fully OA and hybrid journals. We'll talk about what we're seeing in relation to recent years and discuss the broader context for the APC market. If you missed the session, or if you attended and would like to watch/listen again, or share forward with friends, please feel free!
By Lori Carlin March 28, 2025
Delta Think is currently spearheading an industry market research survey to authors and researchers across the scholarly community designed to provide insight into the impact of potential US federal funding reductions on their research. The survey addresses topics such as publication volume, their ability/allowance for peer review, conference participation and attendance, influence on their research scope and topics, and more. Working in collaboration with nearly 25 scholarly societies, we are launching this initiative to capture the real-world impact of these potential changes in order to help societies better plan and support their members, researchers, and authors. The results of the survey will provide scholarly publishers with systematic, quantitative voice-of-market data to inform evidenced-based strategy development and scenario planning in a rapidly changing funding landscape and policy environment. The survey opens this week, with each participating society distributing the link to their own communities. All participating societies will receive an in-depth analysis of the full survey results, filtered by various demographics such as country, career stage, and discipline, as well as options for Delta Think to analyze their specific community data or the raw data from their specific community so they can analyze it themselves. Delta Think has designed the survey and will conduct all the analysis of the results.
By Dan Pollock and Heather Staines March 13, 2025
This month we look at our latest data about Article Processing Charges (APCs). Per article pricing is a fundamental building block for all paid publishing models, so our review provides an invaluable insight into how costs of open access continue to evolve. APC prices in general continue to increase, but at a slower rate compared with this time last year. Important nuances in the distribution of prices continue to affect the value and cost of paid publishing models. Background Each year we survey the list Article Processing Charges (APCs) of a sample of major and significant publishers. Covering more than 20,000 titles going back to 2016, our dataset represents one of the most comprehensive reviews of open access pricing. To compare like for like, we consistently analyze non-discounted, CC BY charges. We take a snapshot at the end of every January, so we can track yearly changes while controlling for the different times of year that publishers may update prices. Our statistics exclude zero or unspecified APCs, although these are included in our underlying data. This allows us to understand trends where publishers choose to charge APCs without skewing averages. We run separate analyses around APC-free models. Headline Changes Going into 2025, we have seen APC pricing increasing but falling back to long-term trends. Fully OA APC list prices across our sample have risen by around 6.5% compared with 9.5% this time last year. Hybrid APC list prices have risen by an average of 3% compared with 4.2% this time last year. Maximum APCs for fully OA journals remain at $8,900. Maximum APCs for hybrid journals now top out at $12,690 (up $400 from last year). Big jumps in prices happened last year, driven by high inflation. In 2020-2021 prices were driven up when high-impact journals began offering OA options for the first time. In both cases, increases subsequently fell back to averages. Underlying trends continue. There are around 2.6x more hybrid journals than fully OA ones, down from 2.9x a year ago. Hybrid journals follow (or, rather, set) a similar pattern to the market overall. On average, fully OA prices are around 64% of those of hybrids. This is a couple of percentage points higher than long term trends. Around 31% of our sample of fully OA journals charge no APCs. (We have separately analyzed the number of articles in OA journals.) Price rises vary significantly by discipline. Arts & Humanities and Social Sciences have seen particularly large average increases, especially in fully OA journal prices. Price Distribution Market-wide headline price changes mask important nuances. We have discussed previously that the most important nuance lies in the spread of prices within a given publisher’s portfolio. For example, if the bulk of a publisher’s journals lie toward the lower end of its pricing, with just a few journals priced at the high end, the average (mean) price will be higher than most authors pay. The following figures show how the spread of prices plays out in the market across our sample of publishers. The figures are outlines of histograms, showing how many titles sit in various price bands over the successive years of data we have curated. The red line shows the most recent year’s prices. The lines become greener as they go further back in time. Subscribers to Delta Think’s Data and Analytics Tool can see full details of axes. Hybrid Prices The spread of price bands for hybrid journals is shown in Figure 1 below.
By Diane Harnish and Meg White February 27, 2025
User information needs as well as funding models are evolving rapidly, as evidenced by Clarivate’s recent move to phase out perpetual access purchases for print, eBooks, and digital collections by the end of 2025. Taking a hard look at how these assets contribute to your portfolio and overall organizational strategy has never been more critical. A holistic books program assessment can help you think intentionally about how books and book-based content can help meet customer and market needs. Publishing and Product Strategy A market-driven publishing and product strategy begins with an understanding of customer information needs. What markets, segments, information needs, and challenges are present? How can customer information needs be addressed? What role can our book content play? How can we differentiate our solutions? Can our book content contribute to a unique value proposition? Thinking creatively about how your content meets market needs is critical; think solutions, not printed pages and chapters. Commercial Strategy A detailed commercial strategy, supported by proper resources, is fundamental to success. Leveraging a clear understanding of customer preferences and delivering messaging that resonates with your specific market segments and use cases is essential. What are the best methods to generate market awareness? When and how should we communicate with key audiences? What messages resonate best? What sales and marketing capabilities do we have internally? Where do we need to partner to reach core audiences? How do we meet global needs? Do we have the appropriate access, pricing, and distribution models in place to meet customer expectations? What do we need to do directly? Where should we cultivate successful channel partnerships? And you don’t have to go it alone; a commercial strategy is best formulated and executed by a combination of internal and external resources. Technology Infrastructure Is your technology optimized to support your book program? From agile content management systems to product platforms to customer relationship management tools, the right tools enable your content and commercial strategy. What systems do we need to ensure efficiency in our publishing processes and quality and integrity in our content? What technologies and platforms do we need to build market-responsive products? What systems do we need to communicate effectively and meaningfully with our customers, including authors? Are we best served by building these systems or partnering? Successfully integrating and leveraging new technologies, such as AI, requires a fundamental understanding of markets and customer information needs . The Numbers Financial metrics are a key measure of the health of any program. An in-depth assessment of a program’s recent performance is a vital tool to help identify strengths, weaknesses, and gaps, and help to surface areas for improvement and corrective action. A financial analysis will clarify: What is our book and content annual output? Is it sufficient to support our strategy and meet customer and market needs? What is our cost structure? Our pricing strategy? Do they align with industry and market norms and expectations? Do we have the appropriate mix of internal and external resources in place to support our strategy? How can we best align our financial performance to contribute to the organization’s larger strategy? Beyond red ink or black ink, financial analysis will provide answers to these questions. Assessing Your Book Program Delta Think partners with publishers to do the foundational analysis necessary to understand how your book and book-based content can be a vital part of your content portfolio and support your organization’s goals and objectives. Our processes, including program benchmarking, stakeholder interviews, surveys, and workshops, combined with expert landscape research and analysis ensure you are building a content strategy that is market-focused and customer-driven. Contact Delta Think at info@deltathink.com to set up a time for a video call to learn more. We will also be attending the London Book Fair, March 11-13, 2025, if you’d like to schedule an in-person chat.
By Dan Pollock and Ann Michael February 20, 2025
Overview A recent post on the Open Café listserv posed a question about the true extent of fee-free open access publishing, but it noted the incomplete coverage of the data cited. We have more comprehensive data, but just as we started our analysis, DeepSeek’s release sent markets into turmoil. The stage was set for a timely experiment. We first answer the question using our data. Then we see how the AI did. Background What proportion of open access is not paid for by APCs? In discussing this, a recent Open Café listserv post cited studies by Walt Crawford – a librarian, well-known in the academic library and OA communities for his analysis of open access. He has paid particular attention to “diamond” OA journals, which charge neither readers nor authors. His studies are based on data from the Directory of Open Access journals ( DOAJ ). Excellent though both sources may be – and, full disclosure, we contribute to the DOAJ – the DOAJ’s remit covers only fully OA (“gold”) journals. As listserv founder Rick Anderson noted, “By counting only articles published in DOAJ-listed journals, Crawford’s studies radically _undercount_ the number of APC-funded OA articles published – because DOAJ does not list hybrid journals, which always charge an APC for OA and which produce a lot of genuinely OA articles (though exactly how many, no one knows).” Using our data Actually, we do know … or at least have some fair estimates of hybrid OA. Our data allows us to determine the share of open access output in APC-free journals, as follows.
By Dan Pollock and Ann Michael February 11, 2025
Overview Following the 2024 US election, the new US administration has instructed employees in some key federal agencies to retract publications arising from federally funded research. This is to allow representatives of the administration to review the language used, to ensure it is consistent with the administration’s political ideology. In this special edition of News & Views, we quantify how many papers might be affected and estimate their share of scholarly publishers’ output. The initial numbers may be small, but we suggest the effects on scholarly publishing could be profound. Background On 20 January 2025, Donald J. Trump took office as the 47th President of the United States. Within hours he signed an Executive Order 1 (EO) 14168 proclaiming that the US government would only recognize two sexes, and ending diversity, equity, and inclusion (DEI) programs inside federal agencies. The following day, his administration instructed federal health agencies to pause all external communications – “such as health advisories, weekly scientific reports, updates to websites and social media posts” – pending their review by presidential appointees. These instructions were delivered to staff at agencies inside the Department of Health and Human Services (DHSS), including the Food and Drug Administration (FDA), the Centers for Disease Control (CDC) and Prevention, and the National Institutes of Health (NIH). The events that followed are important, as they directly affect scholarly papers and our analysis. A memo on 29 January instructed agencies to “end all agency programs that … promote or reflect gender ideology” as defined in the EO. Department heads were instructed to immediately review and terminate any “programs, contracts, and grants” that “promote or inculcate gender ideology.” Among other things, they were to remove any public-facing documents or policies that are trans-affirming and replace the term “gender” with “sex” on official documents. By the start of February, more than 8000 web pages across more than a dozen US government websites were taken down . These included over 3000 pages from the CDC (including 1000 research articles filed under preventing chronic disease, STD treatment guidelines , information about Alzheimer’s warning signs, overdose prevention training , and vaccine guidelines for pregnancy). Other departments affected included the FDA (some clinical trials), the Office of Scientific and Technical Information (the OSTP, removing papers in optics, chemistry and experimental medicine), the Health Resources and Services Administration (covering care for women with opioid addictions, and an FAQ about the Mpox vaccine). Around this time, it further emerged that CDC staff were sent an email directing them to withdraw manuscripts that had been accepted, but not yet published, that did not comply with the EO. Agency staff members were given a list of about 20 forbidden terms, including gender, transgender, pregnant person, pregnant people, LGBT, transsexual, nonbinary, assigned male at birth, assigned female at birth, biologically male, biologically female, and he/she/they/them. All references to DEI and inclusion are also to be removed. The effects of the EO Commenting on the merits of policy and ideology lies beyond our remit. However, when these matters affect the scholarly record – as they clearly do here – then they are of interest for our analyses. Specifically, what might the effects of the EO be on the publication of papers, and what effects might accrue from withdrawal of research funding? If federal agencies are being instructed to withhold or withdraw submissions, then, to quantify what this might mean to publishers, we have estimated the volume of output from a few key federal agencies. It is summarized in the following chart. 
By Lori Carlin January 23, 2025
Emerging technologies are reshaping how we create, distribute, and consume content. Publishers face the critical task of making smart technology investments to stay competitive and enable strategic objectives. How do you ensure that your next tech purchase aligns with your organization's needs and goals? Enter the needs assessment process – your roadmap to making informed, strategic technology decisions. From defining clear objectives to creating a comprehensive RFP, these best practices will help you navigate the decision-making process with confidence and ensure that your investments deliver value for your organization and your customers. Technology is not a solution; it is a tool. The temptation to adopt technology without a clear definition of what you are trying to achieve is an all too common (and usually very costly) mistake. Does your strategy include delivering a more personalized experience for your users? A customer data platform may be the right technology. Interested in using AI to build research integrity into your editorial process? Perhaps it’s time to revisit the capabilities of your editorial management system. Looking to support education and learning for students, faculty, and professional learners? Maybe it is time to evaluate formal learning management systems. Once you are confident about what you are seeking to achieve, the real work begins. Here are the key components that will help lay the foundation for a successful process from inception to deployment: Analyze Current State: Audit existing systems and processes to understand current capabilities and limitations. Conduct a Gap Analysis: Identify gaps between current capabilities and desired future state. Collect and Analyze Data: Gather qualitative and quantitative data from staff, users, customers, industry benchmarks, and about existing systems. Consider Resources and Constraints: Assess available resources, including budget, skills, and time. Research Solutions: Investigate potential technologies and/or types of solutions that could address identified gaps. Prioritize Needs: Work with stakeholders to prioritize needs based on impact and feasibility. Create RFP: After identifying prioritized needs and potential solutions, develop an RFP that clearly outlines project objectives, specific requirements, evaluation criteria, budget, and timelines. Distribute the RFP: Identify vendors with fit for purpose solutions and capabilities and distribute. Evaluate Proposals: Review vendor responses against established criteria and prioritize them based on how well they meet your needs. Plan for Adoption and Training: Consider the change management aspects of introducing new technology and processes. Be sure to develop a plan for user adoption, training, and ongoing support in your new systems. Technology as a Strategic Ally A methodical needs assessment is not just a procurement exercise – it is a strategic opportunity to reimagine how technology can transform your organization. The most successful technology investments are those that solve real problems, align with organizational goals, and empower your team to work more efficiently and creatively. Don’t fall into the trap of just moving what you are currently doing over to a new system. This is an ideal occasion to think about how you would design workflows and processes if you were to start from scratch and use that framework to evaluate the new capabilities available. You don’t want to duplicate what you are doing today; you want to step back and take the opportunity to build something better whenever possible. Customer Data Platform? Editorial Management System? Learning Management System? Something Else? Delta Think partners with publishers to do the foundational and implementation work required to ensure that technology decisions match the organization’s capabilities, fit the budget, and are grounded in voice-of-customer data. Our processes, including stakeholder interviews, surveys, and workshops, combined with expert landscape research, analysis, and assessments, underpin technology decision-making that is market-focused and customer-driven. If your 2025 objectives depend on or are enabled by technology, we’d welcome the opportunity to help you learn, plan, achieve. Please contact us today to start the conversation.
By Dan Pollock and Heather Staines January 14, 2025
A number of sources provide information about patterns in the overall scholarly journals market. However, as we so often mention in our analyses, important nuances lie beneath the headlines. This month we explore just how much variation exists and highlight the importance of specificity. Background As part of our annual market updates, we estimate the proportions of open vs. subscription access content each year. Over the last few years, we have observed how OA has approached 50% of output, but we note that it has yet to punch through that number. However, this headline varies greatly depending on your area of publishing. An example from physics The chart below shows the nuances across just a few of the 200+ subjects that we track.
By Dan Pollock, Ann Michael December 10, 2024
This month’s topic: How much content can AI legally exploit? Scroll down to read about this topic, along with the latest headlines and announcements. Delta Think publishes this News & Views mailing in conjunction with its Data & Analytics Tool . Please forward News & Views to colleagues and friends, who can register to receive News & Views for free each month. Delta Think will be attending several upcoming conferences, including APE (Jan 14-15), NISO Plus (Feb 10-12), and Researcher to Reader (Feb 20-21). We would love to see you there – please get in touch or visit our Events page to see all the meetings we will be attending. How much content can AI legally exploit? O verview During the recent PubsTech conference , we were asked how much content could be legitimately used to train artificial intelligence systems without being specifically secured through a licensing agreement. In considering this question, we find some counterintuitive results. Background Generative AI (genAI) is a type of artificial intelligence that can create new content—text, images, music, and more – by analyzing patterns in massive datasets. These models are typically trained on publicly available data scraped from the web. In the US, developers often invoke the “Fair Use” copyright doctrine to justify this training, claiming it is limited to specific purposes (training) and transformative in nature (different from the original use). In reality, the legal position is complex and evolving , with many rights holders and their representatives – unsurprisingly – taking the opposite view. Even if legal clarity emerges, different geographies and jurisdictions will likely reach different conclusions. The legal complexities of AI and copyright law are beyond our scope. However, for scholarly publishers, particular issues apply. Half of our output is open access , and open access content is designed to be reusable. Open or not, content has varying restrictions on onward use – for example, non-commercial use is often allowed with attribution. How much scholarly content is exploitable?  For the purposes of analysis, we will assume that the license under which content is published will have a material bearing on the legitimacy of its use to train AI systems. Therefore, looking at share of licenses, we might be able to answer our question.
More Posts