News & Views: Total Value of Scholarly Journals Market

Following our recent analysis of the effects of inflation and exchange rates, this month we examine the underlying fundamentals. We look at how the scholarly journals market is defined, as well as its total value.
Background
After we explored of the effects of inflation, we received some questions about our figures on the total value of the scholarly journals market. What was it? Do we have up-to-date numbers?
We cover the numbers below. In addition to providing insight about the total scholarly journals market, we hope they will also illustrate that our data covers more than just the open access segment. These pieces of analysis – which we brand “News and Views” – started life promoting our OA data. However, to put OA into context, we first need to understand the whole market, so we can work out things like OA’s share and how it compares with that of subscription publishing. Upon reflection, we decided to make the reality of our broad coverage more explicit. We have therefore made a few additions to our analyses to show the breadth of data and coverage we have. We hope this will prove useful to our readers and better highlight Delta Think’s breadth of data coverage.
What is “the market”?
Our market sizing focuses on what we term “the addressable scholarly journals market.” We estimate the total amount of money changing hands to pay for scholarly journals, regardless of business model. (So our estimate includes both paid readership and paid publishing – i.e. subscriptions and open access. It does not separate out community journals, which are managed as part of institutions’ day-to-day operations.)
There is no standard list of academic journals, and different indexes have different coverage1. To produce our analysis, we therefore needed to take some pragmatic decisions about definitions and availability of information.
We estimate a list of bona fide academic journals based on their presence in a number of publicly available indexes2. We parse the results to exclude such things as repository copies, conference proceedings series, and so on.
To estimate the money, we run an annual survey of publishers and ask them confidentially about their revenues for scholarly journals. We then project the total from our sample to form a view of the total market. We do this based on the number of articles published and some further survey work to estimate the weighting of the long tail of smaller publishers, which operate at much lower price points to the core market.
In running our analysis, we have noticed that scholarly output comes in fits and starts from one year to the next. Thus, we extract underlying trends to avoid misleading headlines due to short-term variations, although we allow for some variation to account for events such as COVID-19.
There is likely to be “noise” due to differences in interpretation and definitions. However, our sample size is significant – covering more than 40% of published output--and the lion’s share of total value. While we don’t claim our numbers to be perfect, we think they are a good approximation given the limitations of the information available.
Total market value
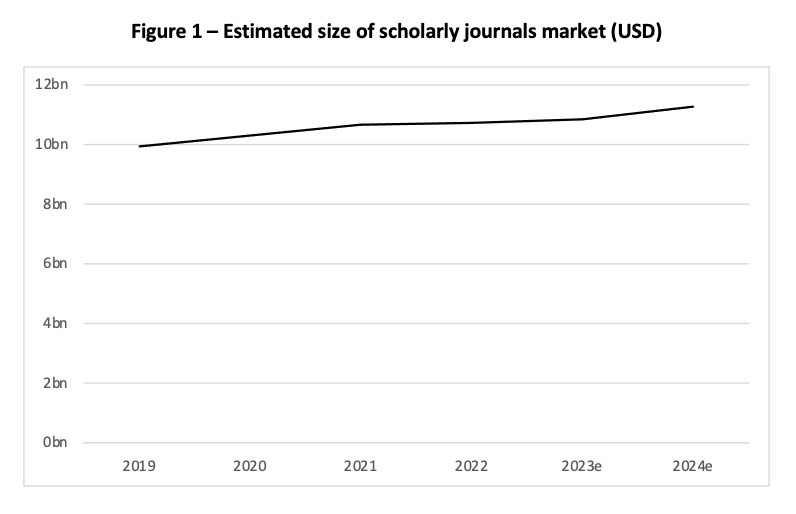
Sources: Delta Think analysis. © 2024, Delta Think Inc. All rights reserved.
The figure above shows the estimated annual value of the scholarly journals market over a 5-year period. In 2022, we estimated it to be $10.7bn, rising to $10.8bn in 2023. We estimate the long-term average growth of the market to be 2.3% per year. The years following COVID saw above-average growth, and the lower growth in 2023 likely represents a correction back to long-term averages. Our estimate for 2024 is based on mathematically projecting prior year’s data.
Conclusion
The executive summary is that we estimate the total scholarly journals market to be worth around $11bn, growing at around 2.3% per year. (As we have previously noted, this translates to a mild decrease in growth in real terms.)
As we discussed above, any estimates about our market are approximations, as there is an absence of clean and consistent data about the make-up of the market. In running any analysis like this, the method is ultimately driven by practicalities, and analyzing data requires qualitative judgements.
It is too early to run our full analysis and survey for 2023, so 2023’s figure is a projection at this point. It is based on indications of sentiment from our previous publisher survey. We will be sending out the latest survey to the usual participants soon, and we will update our estimates later this year once we have had a chance to gather and analyze the data. When we run our update, it will be interesting to see the effects of the recent retractions and the slow-down in output of the major OA publishers.
As ever, subscribers to our market intelligence database (which some of you know as the OADAT; we’re currently in the process of rebranding) can see much more detail behind the charts, including detailed breakouts for subscription, fully open access, and hybrid open access content.
1 Pranckutė, R. Web of Science (WoS) and Scopus: The Titans of Bibliographic Information in Today’s Academic World. Publications 2021, 9, 12. https://doi.org/10.3390/publications9010012
2 We look for journals which have one of: The Norwegian Register for Scientific Journals, Series and Publishers Level 1 or 2 status, or have a DOAJ Seal, or are on the Australian Research Council’s Excellence in Research for Australia (ERA) approved list, or have a SNIP and are a citing source.
This article is © 2024 Delta Think, Inc. It is published under a Creative Commons Attribution-NonCommercial 4.0 International License. Please do get in touch if you want to use it in other contexts – we’re usually pretty accommodating.