News & Views: The Realities of Increasing Open Access Charges
Earlier in the year, we looked at the latest Article Processing Charges (APCs). This month we look at how they have risen compared with inflation. We saw some larger-than-average price rises going into 2024. Does this suggest prices are rising, or might APCs be reducing in real terms?
Background
Each year we survey the list Article Processing Charges (APCs) of over 30 major and significant publishers. Going back to 2015, the dataset includes over 20,000 unique titles and over 130,000 title/year combinations. Going into 2024, we noted significant price increases. Fully OA list prices across our sample rose by around 9.5% compared with those set a year ago. Hybrid list prices rose by an average of 4.2% over the same period. Maximum APCs for fully OA journals remained at $8,900, but those for Hybrid journals now rose to $12,290 (up $600 from the previous year).
Meanwhile, we know that the last few years have seen inflation rise above its long-term averages. As we explored in our analysis “Is the real value of our industry shrinking?,” the revenue coming into the overall scholarly journals market has actually fallen in real terms. So, prices of publishing in general have been reducing slightly. Does this hold for the prices of APCs?
We again use the global Consumer Price Index (CPI) as our inflation index, as we consider it to represent the most realistic view of our market place. Prices exclude zero APCs, so we can see the effects for when publishers choose to charge APCs.
Are APCs becoming cheaper or more expensive?
The chart below shows how increases in all list APCs work out in real terms.
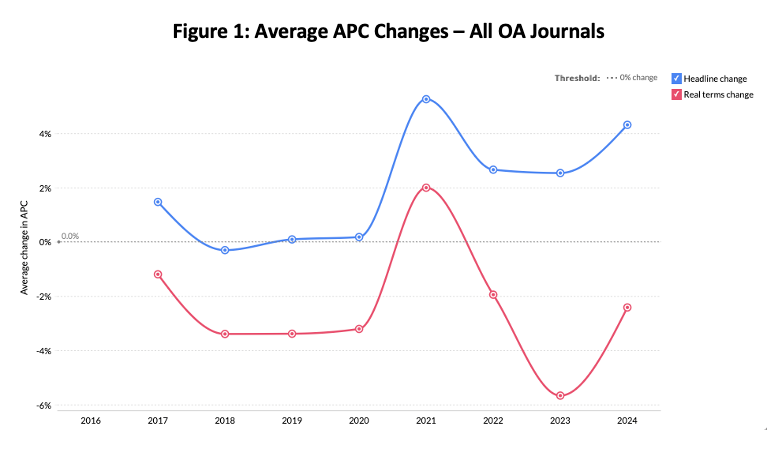
n = 110,217. Sources: the International Monetary Fund, Publishers’ websites (Dec 2016, Jan 2018-Jan 2024), Delta Think analysis. © 2024, Delta Think Inc. All rights reserved.
The figure above compares the average annual changes in APCs as stated (top, blue line) with those adjusted for inflation (bottom, red line).
- Positive numbers mean prices are increasing; negative ones mean they are falling.
- For most years, APCs have fallen in real terms. In other words, they are increasing slower than inflation.
- The exception is in 2021, when we saw large increases but a modest rate of inflation.
- To put the numbers in context, inflation (we use the global CPI) averages around 4%, but we saw it spiking to just over 8% in 2022. It’s likely to be around 6% in 2024.
Fully OA Prices
How does the picture look for the higher rates of increase in just fully OA journal prices? The fully OA landscape is shown in Figure 2.
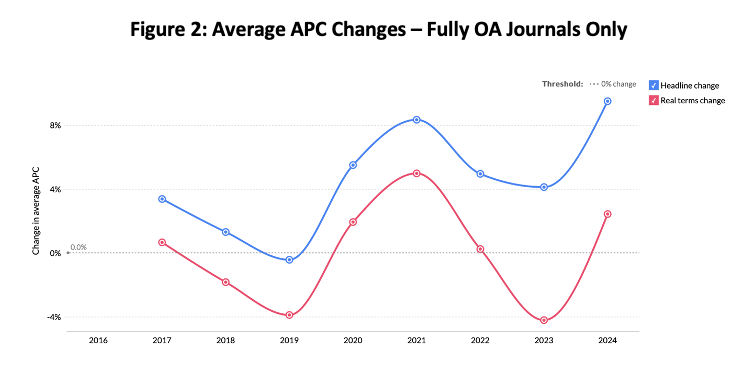
The figure above compares the average annual changes in APCs of fully OA journals as stated (top, blue line) with those adjusted for inflation (bottom, red line).
- As before, positive numbers mean prices are increasing; negative ones mean they are falling.
- Here, the picture is different. Fully OA APCs have risen in real terms as least as often as they have fallen in real terms.
- The above-inflationary price rises were especially noticeable going into 2021 and going into 2024.
Conclusion
Overall, OA prices are increasing below inflation. Our market sizing suggests a real-terms growth in OA market value, so it seems the value of the OA market is driven by demand.
As authors use more and more open access, it’s not surprising that the total spend on it is increasing. However, the data suggest that they are getting (modestly) increasing value for money as they do so, as price rises are falling in real terms. (And to be fair, the same applies for the scholarly journals market overall, which is also seeing volume grow faster than value.)
The prices of fully OA journals are growing faster than inflation on average, but, again, not as fast as demand is growing. Remember, too, that fully OA prices are cheaper than those for hybrid, so they are growing from a lower base.
As discussions continue about the increasing cost and affordability of OA, it’s important to keep an eye on the reality and real terms effects.