News & Views: Open Access Loses Share – Market Sizing 2024 Sneak Peek

Dan Pollock and Heather Staines • July 16, 2024

Each year, Delta Think analyzes the volume and value of the scholarly journals market. This month, we present preliminary results about volumes of journal output ahead of our full sizing results later in the year. Total publication volumes continue to increase across the whole market, and for Open Access. However, Open Access (OA) lost share for the first time in 2023 likely because of problems experienced by the OA publishers in 2022 and 2023. The pace of growth of overall output is falling back to long-term trends after the post-COVID spike.


Headline findings

Our preliminary results for full year 2023 are as follows. Subscribers to our Publishing Data & Analytics Tool can explore these in greater detail, including separating out fully OA and hybrid numbers.


Source: OpenAlex, Delta Think annual publisher survey, Delta Think analysis. © 2024, Delta Think Inc. All rights reserved.


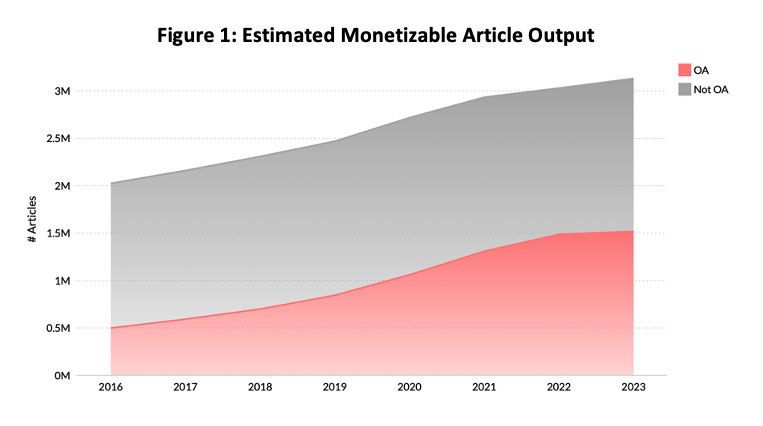
Volumes of articles continue to increase, but 2023 saw some important underlying changes.

  • Total article output grew by 3.4% compared to the previous year.
  • OA article output grew by 2.1%.
  • Based on underlying trends, we estimate a 2023-2025 CAGR (average growth each year) in OA output of around 10%.
  • For the first time, growth in OA fell below that of the underlying scholarly journals market.
  • It is too soon to tell for sure if growth will recover. However, as discussed below, we anticipate growth in OA will pick up again this year, albeit at slightly lower rates than we have seen over the last few years.


Source: OpenAlex, Delta Think annual publisher survey, Delta Think analysis. © 2024, Delta Think Inc. All rights reserved.


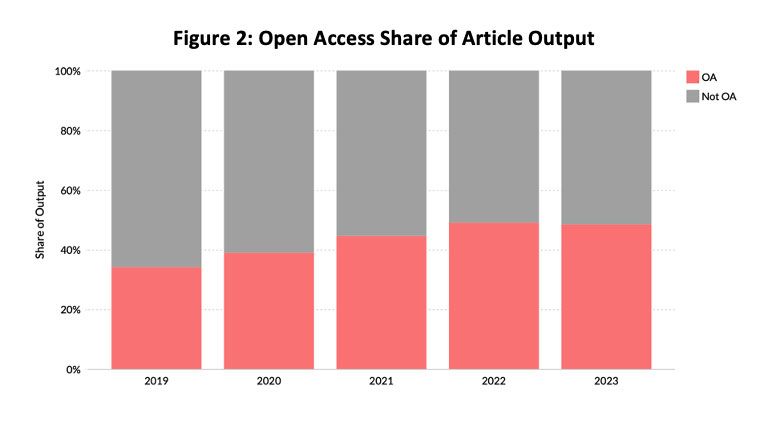
Even though total OA output grew in 2023, it lost share as total output grew faster.

  • OA has historically taken share. We estimate around 45% of paid-for scholarly articles were published OA in 2021, growing to just around 49% in 2022.
  • In 2023, this fell back to around 48%.
  • Although the decline in share is small, it’s significant. Normally OA gains share by a few percentage points per year. For the first time, preliminary data analysis results show it has lost share. This represents a reversal of long-term observations.
  • We should note, however, that the underlying long-term trend is that of continuing growth in OA share. It is too soon to tell if the reversal is permanent, or whether it will pick up again.
  • Last year we anticipated that OA would pass the 50% mark in 2023. This turned out not to be the case, so it does not yet account for the majority of monetizable output.


A note about our method

Each year we survey major publishers. We do not yet have all the results for this year’s survey, but, as ever, we are very grateful to the organizations that participate. We anonymize and aggregate the survey data to inform our estimates. At the time of writing, we have enough results to estimate volumes of output. Our yearly update about market value will follow soon.


Our market estimates focus on the subset of research publications for which money is likely to be paid, either to read or to publish. We focus on underlying trends to inform strategic decision-making, and remove short-term fluctuations which make for interesting headlines, but offer little strategic insight. Our definition of “Open Access” excludes public access (“Bronze”) and repository-only (“Green”) content.


Trends

Last year, we anticipated a slow-down in growth in 2023 as the industry corrected to long-term trends. Events since have exacerbated the slow-down. For the first time, underlying drivers of the market may be showing signs of weakness.

  • COVID-19 led to a significant increase in publishing activity, resulting in above-average volumes and growth rates in 2020 and 2021. 2022 saw lower growth in output of all types compared with the previous year. Our anecdotal evidence at the time suggested a strong 2023.
  • The problems experienced by OA publishers in 2023 – perceived quality problems, special editions, shifts and uncertainty around funder mandates, and loss of Journal Impact Factors – led to a significant decline in their output in 2023. We expect this may continue into 2024.
  • Large and more established publishers have seen their OA output continue to grow. They have likely benefited from authors moving away from fully OA publishers. The data suggest a mix of authors changing their choice of publisher for OA content and moving away from OA entirely. Thus, we see the total output growing while OA loses share.
  • A move away from fully OA publishers has also led to a slight increase in hybrid OA. Growth in hybrid is experiencing an uplift over long-term trends.
  • It’s too soon to tell if there is a systemic slow-down in OA growth entirely, or whether growth in OA output (and in OA publishers) will return to its historically high levels. The outlook for 2024 appears mixed, and we anticipate that growth in OA share will continue to face headwinds in 2024.


Conclusion

Total scholarly journal output has moved back to long-term trends following previous corrections to the post-COVID upswing. Open Access output, however, was held back by issues experienced by OA publishers.


Quality problems due to paper mills and the loss of JIFs for fully OA journals have been well-rehearsed elsewhere. Although affecting a subset of journals, the problems have led to a wider move away from journals published by fully OA publishers. The data suggest a mix of authors choosing alternative venues for their OA papers or rejecting OA completely. Large and more established publishers have seen continued growth in OA, so are likely picking up the slack.


It is worth noting that the fully OA publishers still account for around one fifth of the market’s output. Even with declining output or slowing growth, they will continue to account for a significant share of the market.


Historically, the high growth rates in fully OA publishers’ journal output have fueled the high growth rates in overall OA output. With this fuel running out, we see the whole OA growth engine sputtering. Output in hybrid journals has benefited (whether open or not), and we saw an increase in public access output (aka Bronze) after years of slow decline. Non-OA (subscription) output has also seen a boost. Subscribers to our Publishing Data & Analytics Tool can explore these nuances in more detail; please get in touch if you are interested in finding out more.


The big question is now whether OA growth rates will pick up again, or whether we are seeing some sort of plateauing. Might OA even start losing share?


There are a couple of parallels here. One is that the large Megajournals found their output falling back after initial explosive growth, as the realities of scaling bit them. Could we be seeing something similar affecting the overall OA market?

The other parallel is the stock market. Problems affected relatively small numbers of fully OA journals, but their publishers experienced declines across their portfolios. When a few prominent companies experience problems, then it can cause wider stock market selloffs in the same way. However, after such corrections the market inevitably bounces back. Will this happen to OA output? Only time will tell.


Our industry does not systematically report comprehensive data about market volumes or value. So, any market sizing is an approximation, and figures should be taken as approximate. Subscribers to our Data & Analytics Tool can drill into the numbers in much greater depth, including analyzing society-specific output and subscription output. Please get in touch if you want to know more.


This article is © 2024 Delta Think, Inc. It is published under a Creative Commons Attribution-NonCommercial 4.0 International License. Please do get in touch if you want to use it in other contexts – we’re usually pretty accommodating.

By Dan Pollock and Heather Staines April 22, 2025
In March 2025, we looked at the latest Article Processing Charges (APCs) . This month we focus on how prices have risen relative to inflation. As APC price increases fall back to trend, what does this mean in real terms? Background Each year we survey the list Article Processing Charges (APCs) of more than 30 major and significant publishers. Going back to 2015, the dataset includes more than 20,000 unique titles and 150,000 title per year combinations. Going into 2025, we saw price increases fall back to long-term trends from their unusually high increases in 2024. Fully OA (“gold”) journal list prices across our sample rose by around 6.5%, compared with a 9.5% increase this time last year. Hybrid list prices rose by an average of 3%, compared with 4.2%. Last year’s price rises were above long term trends, but overall we found they were rising below inflation. How does this hold for this year’s price increases? We again use the global Consumer Price Index (CPI) as our inflation index, as we consider it to represent the most realistic view of our marketplace. Prices exclude zero APCs, so we can see the effects for instances when publishers choose to charge APCs. Are APCs becoming cheaper or more expensive? The chart below shows how increases in all list APCs work out in real terms for both hybrid and fully OA journals.
By Heather Staines April 7, 2025
We are proud to share a video recording of our March News & Views companion online discussion forum! Join us to hear the latest trends around APC data, including APCs for both fully OA and hybrid journals. We'll talk about what we're seeing in relation to recent years and discuss the broader context for the APC market. If you missed the session, or if you attended and would like to watch/listen again, or share forward with friends, please feel free!
By Lori Carlin March 28, 2025
Delta Think is currently spearheading an industry market research survey to authors and researchers across the scholarly community designed to provide insight into the impact of potential US federal funding reductions on their research. The survey addresses topics such as publication volume, their ability/allowance for peer review, conference participation and attendance, influence on their research scope and topics, and more. Working in collaboration with nearly 25 scholarly societies, we are launching this initiative to capture the real-world impact of these potential changes in order to help societies better plan and support their members, researchers, and authors. The results of the survey will provide scholarly publishers with systematic, quantitative voice-of-market data to inform evidenced-based strategy development and scenario planning in a rapidly changing funding landscape and policy environment. The survey opens this week, with each participating society distributing the link to their own communities. All participating societies will receive an in-depth analysis of the full survey results, filtered by various demographics such as country, career stage, and discipline, as well as options for Delta Think to analyze their specific community data or the raw data from their specific community so they can analyze it themselves. Delta Think has designed the survey and will conduct all the analysis of the results.
By Dan Pollock and Heather Staines March 13, 2025
This month we look at our latest data about Article Processing Charges (APCs). Per article pricing is a fundamental building block for all paid publishing models, so our review provides an invaluable insight into how costs of open access continue to evolve. APC prices in general continue to increase, but at a slower rate compared with this time last year. Important nuances in the distribution of prices continue to affect the value and cost of paid publishing models. Background Each year we survey the list Article Processing Charges (APCs) of a sample of major and significant publishers. Covering more than 20,000 titles going back to 2016, our dataset represents one of the most comprehensive reviews of open access pricing. To compare like for like, we consistently analyze non-discounted, CC BY charges. We take a snapshot at the end of every January, so we can track yearly changes while controlling for the different times of year that publishers may update prices. Our statistics exclude zero or unspecified APCs, although these are included in our underlying data. This allows us to understand trends where publishers choose to charge APCs without skewing averages. We run separate analyses around APC-free models. Headline Changes Going into 2025, we have seen APC pricing increasing but falling back to long-term trends. Fully OA APC list prices across our sample have risen by around 6.5% compared with 9.5% this time last year. Hybrid APC list prices have risen by an average of 3% compared with 4.2% this time last year. Maximum APCs for fully OA journals remain at $8,900. Maximum APCs for hybrid journals now top out at $12,690 (up $400 from last year). Big jumps in prices happened last year, driven by high inflation. In 2020-2021 prices were driven up when high-impact journals began offering OA options for the first time. In both cases, increases subsequently fell back to averages. Underlying trends continue. There are around 2.6x more hybrid journals than fully OA ones, down from 2.9x a year ago. Hybrid journals follow (or, rather, set) a similar pattern to the market overall. On average, fully OA prices are around 64% of those of hybrids. This is a couple of percentage points higher than long term trends. Around 31% of our sample of fully OA journals charge no APCs. (We have separately analyzed the number of articles in OA journals.) Price rises vary significantly by discipline. Arts & Humanities and Social Sciences have seen particularly large average increases, especially in fully OA journal prices. Price Distribution Market-wide headline price changes mask important nuances. We have discussed previously that the most important nuance lies in the spread of prices within a given publisher’s portfolio. For example, if the bulk of a publisher’s journals lie toward the lower end of its pricing, with just a few journals priced at the high end, the average (mean) price will be higher than most authors pay. The following figures show how the spread of prices plays out in the market across our sample of publishers. The figures are outlines of histograms, showing how many titles sit in various price bands over the successive years of data we have curated. The red line shows the most recent year’s prices. The lines become greener as they go further back in time. Subscribers to Delta Think’s Data and Analytics Tool can see full details of axes. Hybrid Prices The spread of price bands for hybrid journals is shown in Figure 1 below.
By Diane Harnish and Meg White February 27, 2025
User information needs as well as funding models are evolving rapidly, as evidenced by Clarivate’s recent move to phase out perpetual access purchases for print, eBooks, and digital collections by the end of 2025. Taking a hard look at how these assets contribute to your portfolio and overall organizational strategy has never been more critical. A holistic books program assessment can help you think intentionally about how books and book-based content can help meet customer and market needs. Publishing and Product Strategy A market-driven publishing and product strategy begins with an understanding of customer information needs. What markets, segments, information needs, and challenges are present? How can customer information needs be addressed? What role can our book content play? How can we differentiate our solutions? Can our book content contribute to a unique value proposition? Thinking creatively about how your content meets market needs is critical; think solutions, not printed pages and chapters. Commercial Strategy A detailed commercial strategy, supported by proper resources, is fundamental to success. Leveraging a clear understanding of customer preferences and delivering messaging that resonates with your specific market segments and use cases is essential. What are the best methods to generate market awareness? When and how should we communicate with key audiences? What messages resonate best? What sales and marketing capabilities do we have internally? Where do we need to partner to reach core audiences? How do we meet global needs? Do we have the appropriate access, pricing, and distribution models in place to meet customer expectations? What do we need to do directly? Where should we cultivate successful channel partnerships? And you don’t have to go it alone; a commercial strategy is best formulated and executed by a combination of internal and external resources. Technology Infrastructure Is your technology optimized to support your book program? From agile content management systems to product platforms to customer relationship management tools, the right tools enable your content and commercial strategy. What systems do we need to ensure efficiency in our publishing processes and quality and integrity in our content? What technologies and platforms do we need to build market-responsive products? What systems do we need to communicate effectively and meaningfully with our customers, including authors? Are we best served by building these systems or partnering? Successfully integrating and leveraging new technologies, such as AI, requires a fundamental understanding of markets and customer information needs . The Numbers Financial metrics are a key measure of the health of any program. An in-depth assessment of a program’s recent performance is a vital tool to help identify strengths, weaknesses, and gaps, and help to surface areas for improvement and corrective action. A financial analysis will clarify: What is our book and content annual output? Is it sufficient to support our strategy and meet customer and market needs? What is our cost structure? Our pricing strategy? Do they align with industry and market norms and expectations? Do we have the appropriate mix of internal and external resources in place to support our strategy? How can we best align our financial performance to contribute to the organization’s larger strategy? Beyond red ink or black ink, financial analysis will provide answers to these questions. Assessing Your Book Program Delta Think partners with publishers to do the foundational analysis necessary to understand how your book and book-based content can be a vital part of your content portfolio and support your organization’s goals and objectives. Our processes, including program benchmarking, stakeholder interviews, surveys, and workshops, combined with expert landscape research and analysis ensure you are building a content strategy that is market-focused and customer-driven. Contact Delta Think at info@deltathink.com to set up a time for a video call to learn more. We will also be attending the London Book Fair, March 11-13, 2025, if you’d like to schedule an in-person chat.
By Dan Pollock and Ann Michael February 20, 2025
Overview A recent post on the Open Café listserv posed a question about the true extent of fee-free open access publishing, but it noted the incomplete coverage of the data cited. We have more comprehensive data, but just as we started our analysis, DeepSeek’s release sent markets into turmoil. The stage was set for a timely experiment. We first answer the question using our data. Then we see how the AI did. Background What proportion of open access is not paid for by APCs? In discussing this, a recent Open Café listserv post cited studies by Walt Crawford – a librarian, well-known in the academic library and OA communities for his analysis of open access. He has paid particular attention to “diamond” OA journals, which charge neither readers nor authors. His studies are based on data from the Directory of Open Access journals ( DOAJ ). Excellent though both sources may be – and, full disclosure, we contribute to the DOAJ – the DOAJ’s remit covers only fully OA (“gold”) journals. As listserv founder Rick Anderson noted, “By counting only articles published in DOAJ-listed journals, Crawford’s studies radically _undercount_ the number of APC-funded OA articles published – because DOAJ does not list hybrid journals, which always charge an APC for OA and which produce a lot of genuinely OA articles (though exactly how many, no one knows).” Using our data Actually, we do know … or at least have some fair estimates of hybrid OA. Our data allows us to determine the share of open access output in APC-free journals, as follows.
By Dan Pollock and Ann Michael February 11, 2025
Overview Following the 2024 US election, the new US administration has instructed employees in some key federal agencies to retract publications arising from federally funded research. This is to allow representatives of the administration to review the language used, to ensure it is consistent with the administration’s political ideology. In this special edition of News & Views, we quantify how many papers might be affected and estimate their share of scholarly publishers’ output. The initial numbers may be small, but we suggest the effects on scholarly publishing could be profound. Background On 20 January 2025, Donald J. Trump took office as the 47th President of the United States. Within hours he signed an Executive Order 1 (EO) 14168 proclaiming that the US government would only recognize two sexes, and ending diversity, equity, and inclusion (DEI) programs inside federal agencies. The following day, his administration instructed federal health agencies to pause all external communications – “such as health advisories, weekly scientific reports, updates to websites and social media posts” – pending their review by presidential appointees. These instructions were delivered to staff at agencies inside the Department of Health and Human Services (DHSS), including the Food and Drug Administration (FDA), the Centers for Disease Control (CDC) and Prevention, and the National Institutes of Health (NIH). The events that followed are important, as they directly affect scholarly papers and our analysis. A memo on 29 January instructed agencies to “end all agency programs that … promote or reflect gender ideology” as defined in the EO. Department heads were instructed to immediately review and terminate any “programs, contracts, and grants” that “promote or inculcate gender ideology.” Among other things, they were to remove any public-facing documents or policies that are trans-affirming and replace the term “gender” with “sex” on official documents. By the start of February, more than 8000 web pages across more than a dozen US government websites were taken down . These included over 3000 pages from the CDC (including 1000 research articles filed under preventing chronic disease, STD treatment guidelines , information about Alzheimer’s warning signs, overdose prevention training , and vaccine guidelines for pregnancy). Other departments affected included the FDA (some clinical trials), the Office of Scientific and Technical Information (the OSTP, removing papers in optics, chemistry and experimental medicine), the Health Resources and Services Administration (covering care for women with opioid addictions, and an FAQ about the Mpox vaccine). Around this time, it further emerged that CDC staff were sent an email directing them to withdraw manuscripts that had been accepted, but not yet published, that did not comply with the EO. Agency staff members were given a list of about 20 forbidden terms, including gender, transgender, pregnant person, pregnant people, LGBT, transsexual, nonbinary, assigned male at birth, assigned female at birth, biologically male, biologically female, and he/she/they/them. All references to DEI and inclusion are also to be removed. The effects of the EO Commenting on the merits of policy and ideology lies beyond our remit. However, when these matters affect the scholarly record – as they clearly do here – then they are of interest for our analyses. Specifically, what might the effects of the EO be on the publication of papers, and what effects might accrue from withdrawal of research funding? If federal agencies are being instructed to withhold or withdraw submissions, then, to quantify what this might mean to publishers, we have estimated the volume of output from a few key federal agencies. It is summarized in the following chart. 
By Lori Carlin January 23, 2025
Emerging technologies are reshaping how we create, distribute, and consume content. Publishers face the critical task of making smart technology investments to stay competitive and enable strategic objectives. How do you ensure that your next tech purchase aligns with your organization's needs and goals? Enter the needs assessment process – your roadmap to making informed, strategic technology decisions. From defining clear objectives to creating a comprehensive RFP, these best practices will help you navigate the decision-making process with confidence and ensure that your investments deliver value for your organization and your customers. Technology is not a solution; it is a tool. The temptation to adopt technology without a clear definition of what you are trying to achieve is an all too common (and usually very costly) mistake. Does your strategy include delivering a more personalized experience for your users? A customer data platform may be the right technology. Interested in using AI to build research integrity into your editorial process? Perhaps it’s time to revisit the capabilities of your editorial management system. Looking to support education and learning for students, faculty, and professional learners? Maybe it is time to evaluate formal learning management systems. Once you are confident about what you are seeking to achieve, the real work begins. Here are the key components that will help lay the foundation for a successful process from inception to deployment: Analyze Current State: Audit existing systems and processes to understand current capabilities and limitations. Conduct a Gap Analysis: Identify gaps between current capabilities and desired future state. Collect and Analyze Data: Gather qualitative and quantitative data from staff, users, customers, industry benchmarks, and about existing systems. Consider Resources and Constraints: Assess available resources, including budget, skills, and time. Research Solutions: Investigate potential technologies and/or types of solutions that could address identified gaps. Prioritize Needs: Work with stakeholders to prioritize needs based on impact and feasibility. Create RFP: After identifying prioritized needs and potential solutions, develop an RFP that clearly outlines project objectives, specific requirements, evaluation criteria, budget, and timelines. Distribute the RFP: Identify vendors with fit for purpose solutions and capabilities and distribute. Evaluate Proposals: Review vendor responses against established criteria and prioritize them based on how well they meet your needs. Plan for Adoption and Training: Consider the change management aspects of introducing new technology and processes. Be sure to develop a plan for user adoption, training, and ongoing support in your new systems. Technology as a Strategic Ally A methodical needs assessment is not just a procurement exercise – it is a strategic opportunity to reimagine how technology can transform your organization. The most successful technology investments are those that solve real problems, align with organizational goals, and empower your team to work more efficiently and creatively. Don’t fall into the trap of just moving what you are currently doing over to a new system. This is an ideal occasion to think about how you would design workflows and processes if you were to start from scratch and use that framework to evaluate the new capabilities available. You don’t want to duplicate what you are doing today; you want to step back and take the opportunity to build something better whenever possible. Customer Data Platform? Editorial Management System? Learning Management System? Something Else? Delta Think partners with publishers to do the foundational and implementation work required to ensure that technology decisions match the organization’s capabilities, fit the budget, and are grounded in voice-of-customer data. Our processes, including stakeholder interviews, surveys, and workshops, combined with expert landscape research, analysis, and assessments, underpin technology decision-making that is market-focused and customer-driven. If your 2025 objectives depend on or are enabled by technology, we’d welcome the opportunity to help you learn, plan, achieve. Please contact us today to start the conversation.
By Dan Pollock and Heather Staines January 14, 2025
A number of sources provide information about patterns in the overall scholarly journals market. However, as we so often mention in our analyses, important nuances lie beneath the headlines. This month we explore just how much variation exists and highlight the importance of specificity. Background As part of our annual market updates, we estimate the proportions of open vs. subscription access content each year. Over the last few years, we have observed how OA has approached 50% of output, but we note that it has yet to punch through that number. However, this headline varies greatly depending on your area of publishing. An example from physics The chart below shows the nuances across just a few of the 200+ subjects that we track.
By Dan Pollock, Ann Michael December 10, 2024
This month’s topic: How much content can AI legally exploit? Scroll down to read about this topic, along with the latest headlines and announcements. Delta Think publishes this News & Views mailing in conjunction with its Data & Analytics Tool . Please forward News & Views to colleagues and friends, who can register to receive News & Views for free each month. Delta Think will be attending several upcoming conferences, including APE (Jan 14-15), NISO Plus (Feb 10-12), and Researcher to Reader (Feb 20-21). We would love to see you there – please get in touch or visit our Events page to see all the meetings we will be attending. How much content can AI legally exploit? O verview During the recent PubsTech conference , we were asked how much content could be legitimately used to train artificial intelligence systems without being specifically secured through a licensing agreement. In considering this question, we find some counterintuitive results. Background Generative AI (genAI) is a type of artificial intelligence that can create new content—text, images, music, and more – by analyzing patterns in massive datasets. These models are typically trained on publicly available data scraped from the web. In the US, developers often invoke the “Fair Use” copyright doctrine to justify this training, claiming it is limited to specific purposes (training) and transformative in nature (different from the original use). In reality, the legal position is complex and evolving , with many rights holders and their representatives – unsurprisingly – taking the opposite view. Even if legal clarity emerges, different geographies and jurisdictions will likely reach different conclusions. The legal complexities of AI and copyright law are beyond our scope. However, for scholarly publishers, particular issues apply. Half of our output is open access , and open access content is designed to be reusable. Open or not, content has varying restrictions on onward use – for example, non-commercial use is often allowed with attribution. How much scholarly content is exploitable?  For the purposes of analysis, we will assume that the license under which content is published will have a material bearing on the legitimacy of its use to train AI systems. Therefore, looking at share of licenses, we might be able to answer our question.
More Posts