News & Views: The Impact of Transformative Agreements on the Value of the Big Deal, Part 1: Methodology

This month’s News & Views is derived from ongoing research involving Michael Levine-Clark, John McDonald, Jason Price, and Heather Staines. This content, and the May News & Views, is based on a session presented at the Charleston Conference in November 2021.
How does the growth of a particular publisher's open access content factor into the relative value of a Big Deal?
As open access publishing has grown, libraries have begun to question the value of their expensive Big Deal subscriptions. Data from Delta Think show that OA articles account for an increasing percentage of overall publishing. This study examines those data as well as usage data from library subscriptions to determine whether the overall value of Big Deals is decreasing. Included in this study is a detailed explanation for how to remove outliers to create a more reliable data set - an important component of any study, and one that could be used by librarians who wish to perform a similar analysis on their own collections. Part 2 (to be published in the May News & Views) will include the findings of this study, which are informed by information from the Delta Think Open Access Data & Analytics Tool.
This study utilizes COUNTER usage data from twenty libraries [note: eight libraries are Carnegie Research 1 (or Doctoral Very High Research Activity) and 12 others range from R2 (or High Research Activity) down to small baccalaureate] - all chosen because they had Big Deals with the publishers used in this study. The study used two large publishers with a mix of gold, hybrid, and non-OA titles across a four to five year period (note: 2016-2020 and 2017-2020 respectively).
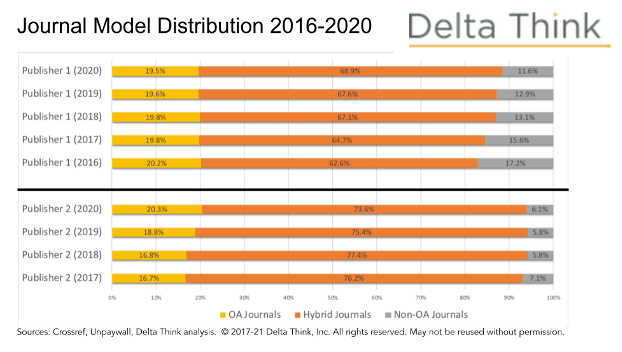
Using data about those two publishers from Delta Think, we see that open access publication is possible - via either gold or hybrid journals - across 85-95% of the publisher portfolio - slightly higher for Publisher 2 (Figure 1).
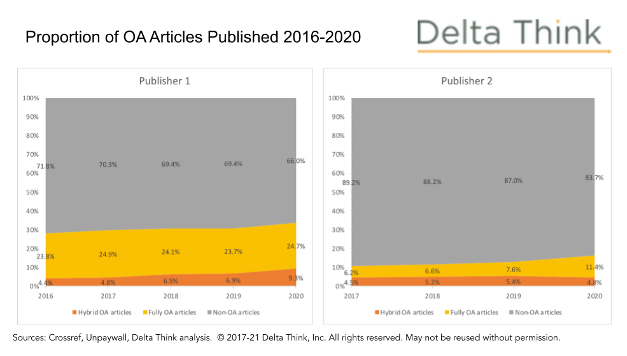
When we look at the articles actually published, the numbers are lower. Gold articles ranged from about 23% to 25% of publishing output for Publisher 1, while OA articles in hybrid journals increased from 4.4% to 9.3% over five years. Publisher 2 follows the same pattern but with 6.5% to 11.5% gold and a fairly consistent 4.3% to 5.4% for hybrid over four years. Both publishers show an increase in gold articles as a percentage of total output over time. Hybrid increases slightly for Publisher 1 and decreases slightly for Publisher 2. (Figure 2) It is important to keep these numbers in mind as we turn to usage data.
We looked at COUNTER 5 Title Master Reports for each library, noting in particular Access Type, which divides usage into Controlled and OA gold. We cleaned up the data to remove fully OA journals, which would be open on the publisher website whether or not a big deal was in place. However, if gold titles also showed controlled usage, we kept these in, assuming that only a subset of the journal run was open. Usage in hybrid journals was retained.
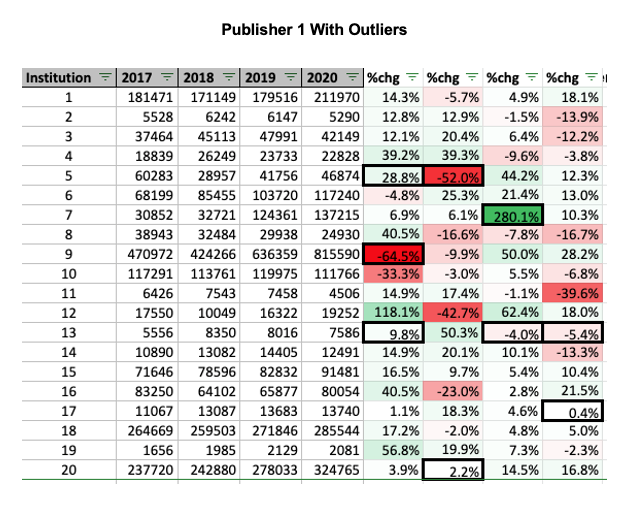
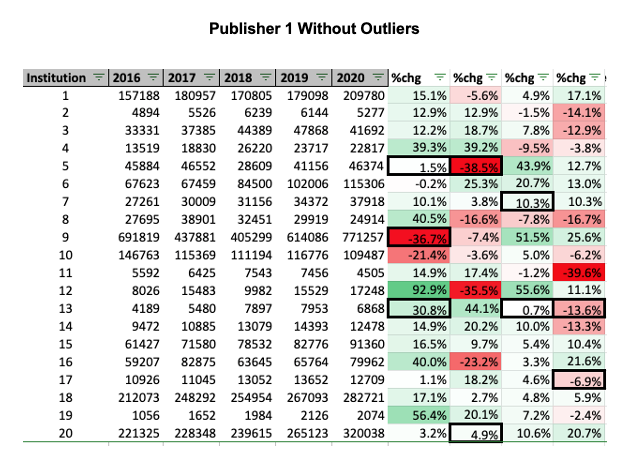
We also removed outliers whose usage seemed to indicate that something unusual had happened, potentially a breach. Our exclusion criteria took out any title that had over 1,000 requests in a single year, but fewer than 100 in the previous or following year, or any time when the total for one year was more than two times all other years’ totals combined. For example, if there was a title that had 4,000 uses in one year, but the other four years added up to less than 2,000, we removed that title as well. Outliers removed based on this sort of pattern included 863 university-by-journal combinations in all (out of a total of 143,833) or about 0.6% of the total usage.
New Paragraph