News & Views: How does the growth of a particular publisher’s open access content factor into the relative value of a Big Deal? Part 2: The Findings
This month’s News & Views is the second part of an article derived from ongoing research involving Michael Levine-Clark, John McDonald, Jason Price, and Heather Staines. This content, and the previous April 2022 News & Views, is based on a session presented at the Charleston Conference in November 2021.
Introduction
If you missed our April News & Views containing Part 1 of this investigation, please review it here.
Now that data sources for both institutions and publishers have been identified and usage outliers removed, we can get to the analysis of whether growth in OA affects value.
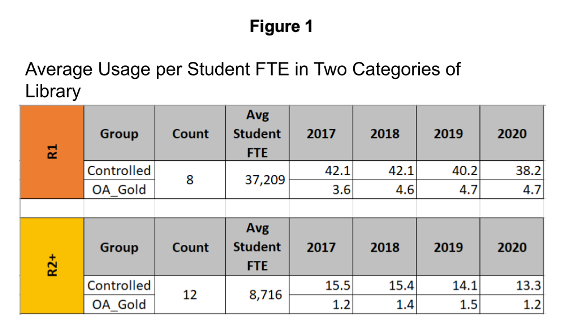
First, let’s look at usage of our two publishers’ content at the broad level of Carnegie class. (Figure 1) To recap, there is a group of eight libraries in the R1 Very High Research activity category with an average student FTE of 37,000. Our 12 smaller institutions, the R2+ group, have an average student FTE of 8,700. We see a higher average usage in the R1 group, with 38-42 uses per student FTE. Meanwhile, the R2+ group average 13-15 uses per student. For both groups, open access gold usage accounted for approximately 10% of the controlled usage.
We can now look into whether the value of the Big Deal is declining.
Cost per Controlled Use (CPCU)
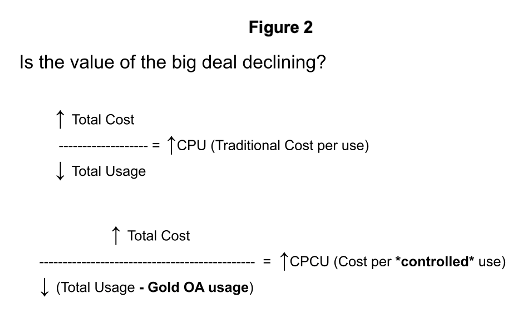
The standard metric used to determine package value is cost per use (CPU). A decline in package value (increase in cost per use) would occur if there is an increase in total cost or a decrease in total usage (or both). However, to take into account the underlying usage of publisher-hosted gold open access articles, we need to remove that freely-available usage from the denominator. Cost per controlled use (CPCU) does just that. (Figure 2)
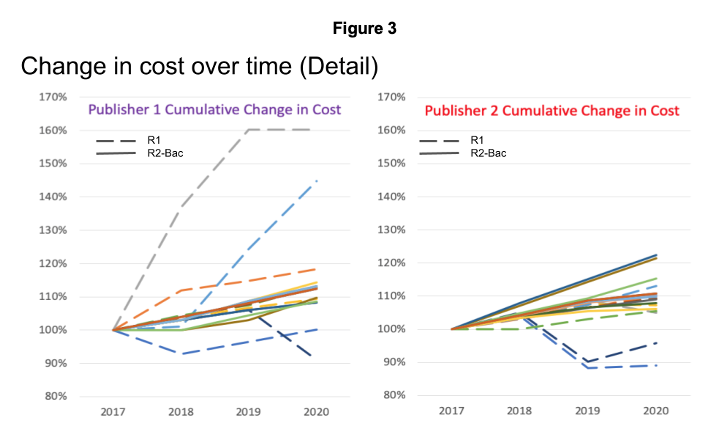
The next set of figures addresses each of three factors: total cost, total usage, and gold OA usage, depicting a detailed view and a summary view of each trend over the five years of the study. The last set of figures brings them back together, comparing cost per use and cost per controlled use over time. Each line represents an individual institution, and their colors are consistent throughout. The dashed lines are the Carnegie Very High Research institutions (or R1s for short). The solid lines include High Research Intensity (R2s) on down to Baccalaureate institutions (R2-Bac for short).
It will likely not be surprising to anyone that most institutions’ costs increased over time. Figure 3 also reveals that Publisher 1 shows more variation in the cumulative change in cost with a few R1 institutions showing quite large increases and two experiencing cost reductions. It is worth noting that the two institutions that had decreases for Publisher 1 also had decreased prices for Publisher 2.
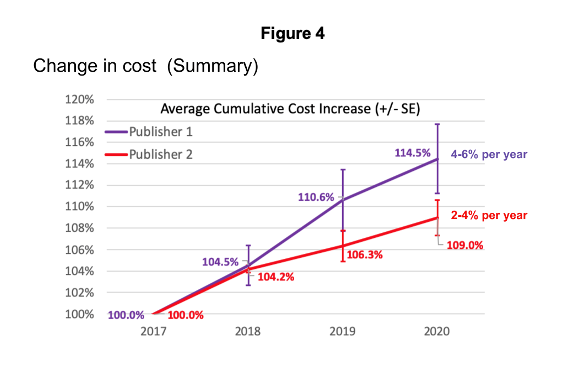
Summarizing these same data (Figure 4), Publisher 1’s package cost (in purple) increased 4 to 6% per year and Publisher 2’s package cost (in red) increased 2 to 4% per year (with the error bars reflecting Standard Errors). Publisher 1’s cumulative cost increased more than Publisher 2’s in 2019 and 2020: these increasing costs create downward pressure on package value.
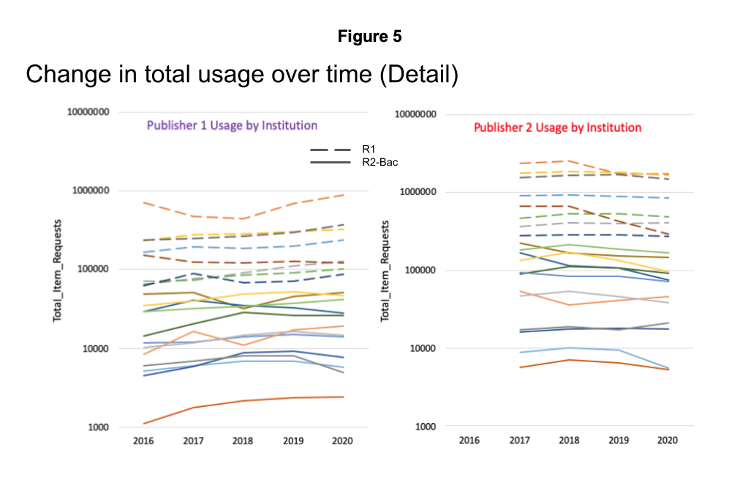
Next, we move to usage. To make it easier to see the trends, we plotted Total Item Requests on a log scale. (Figure 5) As one might expect, the large, research intensive institutions (dashed lines) had the highest usage for both publishers. Even with outliers removed, some institutions experienced large fluctuations in usage from year to year.
We also see differences in usage trends for the two publishers. Usage increased for 14 out of 20 institutions for Publisher 1 from 2017 through 2020, despite the start of ‘work from home’ in March of 2020. For Publisher 2 over the same period of time, 15 out of 20 institutions’ usage declined.
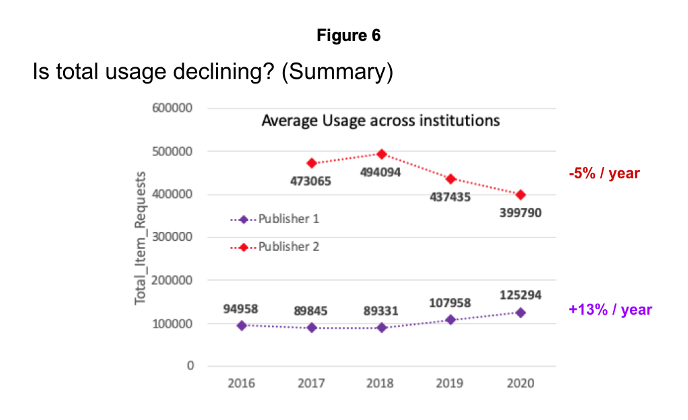
We can look at the average usage for each publisher to see whether total usage is declining. (Figure 6) For Publisher 1 (in purple), the answer is no. The increase seen from 2017 to 2020 amounts to almost 40% or an average of 13% increase per year. In contrast, usage of Publisher 2’s content declined about 15% in the same time period, starting in 2019 and resulting in an average decline of about 5% per year. Thus, in the case of Publisher 2, we see both an increase in price and a decrease in usage, both contributing to declining value.
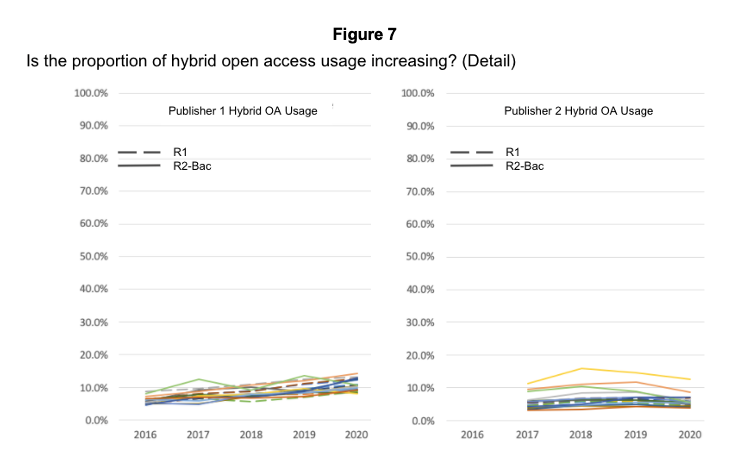
The proportion of total usage of content that is freely available within the package is a third factor that can impact the value of journal packages over time. As detailed in Figure 7, that proportion is fairly small and fairly consistent across the institutions. These data are plotted on a 0 to 100% scale to highlight the fact that 85-95% of usage still comes from paywalled ‘controlled’ content. (Figure 7)
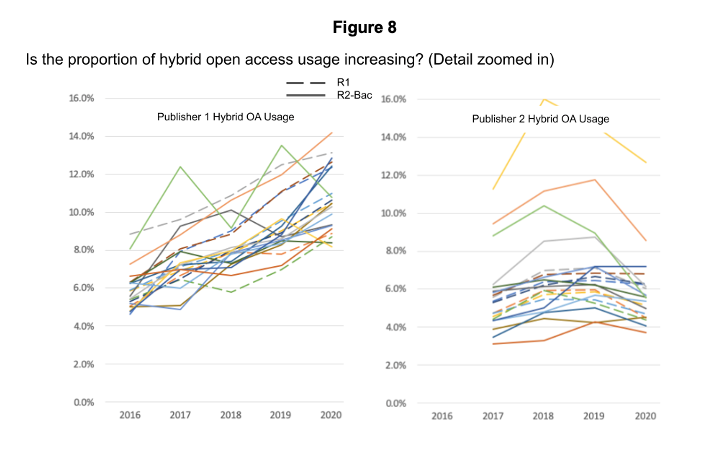
Now, let’s zoom in on that same data. In Figure 8, we see that trends in usage of publisher-hosted open access differ between these two publishers. Publisher 1, on the left, shows a clear increase in the proportion of OA usage. Publisher 2 is less clear with the proportion of hybrid usage of some institutions appearing to peak midway through.
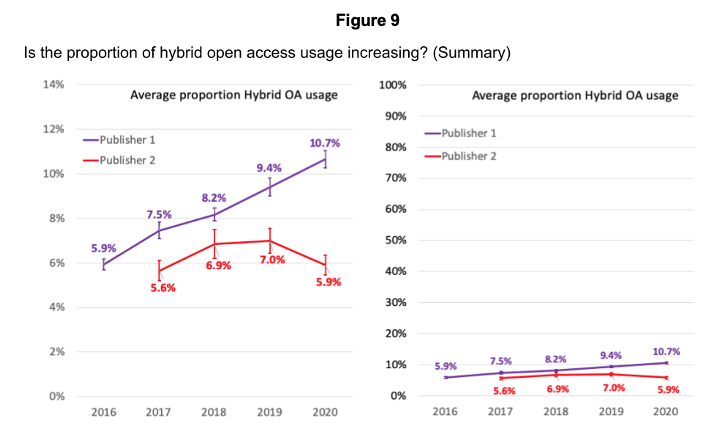
When one looks at the averages in Figure 9, the differences are clear. The proportional use of Publisher 1’s hybrid open access articles is increasing by about 1 to 1.5% per year (in purple), while Publisher 2’s usage is effectively flat. The right side of the figure uses a 0 to 100% scale to remind us that the annual average change in hybrid OA usage has still been quite small.
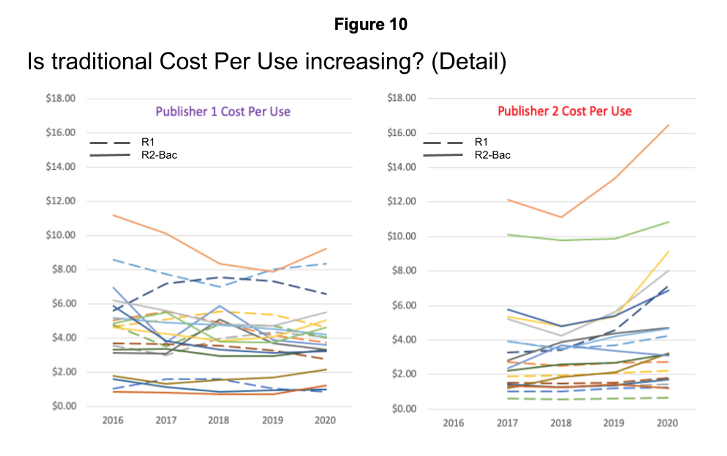
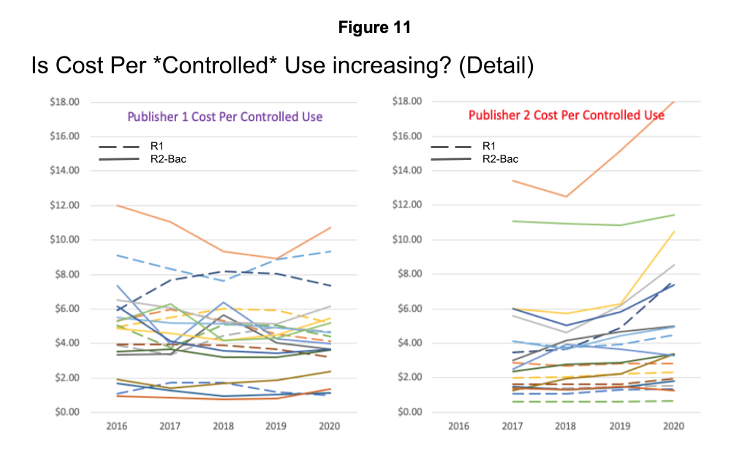
Next we move to cost per use. (Figure 10) Once we put the costs and total usage together to calculate cost per use, we learn that institutions tend to experience flat or decreasing cost per use for Publisher 1 and flat or increasing cost per use for Publisher 2. Because the change in the proportion of hybrid use is so small, when we adjust for cost per controlled use (Figure 11), the lines only move up a bit, retaining their shape, to reflect the removal of hybrid open access use from the denominator.
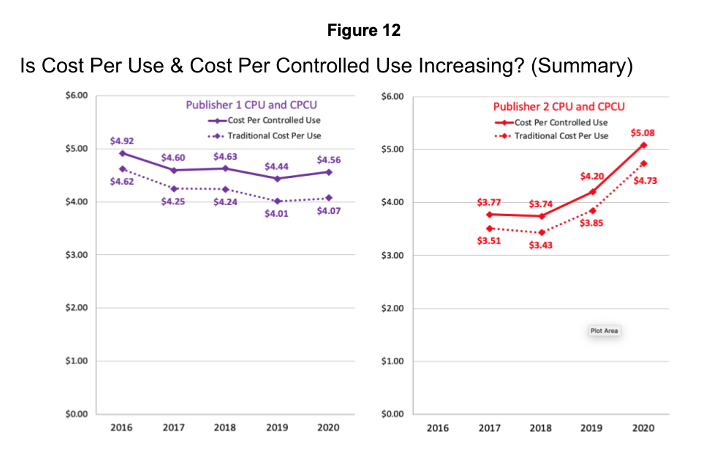
In the summary chart, we compare cost per controlled use and cost per use directly. (Figure 12) The cost per controlled use, indicated by the solid lines, is always higher than traditional cost per use (dashed lines). The difference is driven by the proportion of hybrid open access.
To the extent that transformative agreements lead to more rapid increase in the proportion of hybrid OA content and use over time, then these lines should diverge, with cost per controlled use increasing faster than traditional cost per use. Given this, we suggest that cost per controlled use should be used as a standard measure going forward.
Now, when we bring cost per controlled use from the two publishers together on the same axis, we can see a clear difference in their multi-year trends. (Figure 13) The purple line (Publisher 1) shows a slow decrease in cost per controlled use over time, whereas Publisher 2 shows a fairly rapid increase in 2019 and 2020. Next, we can reverse the y axis to acknowledge that increasing cost per controlled use equates to a decline in value. Therefore, Publisher 1’s package (in purple) is slowly increasing in value, and Publisher 2’s (in red) shows a sharp decline. (Figure 13) So, value did decline for one of the two publishers examined. To review: (1) average cost increased 2 to 6% per year, (2) average usage changed by between +10 and -5% per year over a four year period (and it was by far the most variable across institutions), and (3) the average proportion of hybrid OA usage changed by about 1% per year.

Conclusion
Some final thoughts: (1) Overall usage was a stronger influence on the change in value than the small changes in the proportion of hybrid OA article usage. (2) Despite the range of research activity levels across our institutions, there wasn’t much difference in the proportion of the open versus controlled usage across the site-licensed institutions for either publisher. (3) COVID likely affected these trends, but precisely how was unclear. Did lockdown increase the usage or limit it? Did it affect our two publishers differently? We have no ‘non-COVID’ control unfortunately. (4) If the impact of transformative agreements on the rate of hybrid OA article output influenced these trends, the impact was quite small. Still, with more libraries negotiating transformative agreements, growth in the proportion of OA articles should accelerate. As long as usage in publisher packages continues to grow, cost per controlled use will increase more quickly than cost per use. This new cost per controlled use metric should help libraries track the return on investment from their journal package subscription payments as a growing proportion of underlying articles are free to read.
This article is © 2022 Delta Think, Inc. It is published under a Creative Commons Attribution-NonCommercial 4.0 International License. Please do get in touch if you want to use it in other contexts – we’re usually pretty accommodating.