News & Views: Open Access Market Sizing Update 2020
Overview
Delta Think's OA Market Sizing (i.e., revenue generated by providers or, conversely, costs incurred to buyers of content) shows that the open access market continues to grow faster than the underlying journals publishing market. Based on current trends, we estimate it to have been worth around $763m in 2019 and on track to grow to around $850m in 2020.
Headline numbers
Updates to key industry indexes are released over the summer, and we combine these with benchmarks obtained from our publisher survey to size the market. Our models, examined in greater depth within our Open Access Data & Analytics Tool, suggest these headlines for sizing:
We estimate that the OA market grew to around $763m in 2019.
- The 13% increase over 2018 is larger than the growth in the underlying scholarly journals market, which is typically low to mid-single digit.
- Trends in the data suggest that the growth rate in open access has been falling over previous years and will fall over the coming years to around 12% annually, but will remain above the underlying market rates. The open access market is on target to be over $850m in 2020.
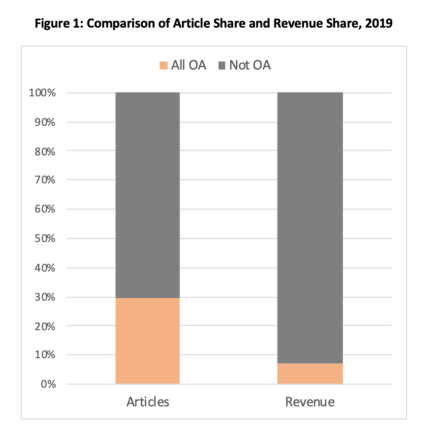
- Just over 30% of all scholarly articles are published as paid-for open access, accounting for just over 7% of the total journal publishing market value.
- We anticipate a 2019-2022 CAGR of just over 10.5% in OA output and 11.5% in OA market value.
A note about our method
We aggregate data from our exclusive annual publisher survey – which now covers around two thirds of indexed global output, and just under half of everything in Crossref – and project it against patterns in the Unpaywall and OpenAPC data sets to model the entire market. As so few publishers account for such a large proportion of our market’s output and value, we need to compensate for variations exhibited by individual publishers to focus on underlying trends.
We base our estimates on the extrapolation of previously established trends. If these trends were to change (e.g., COVID-19 impact, accelerated transformative agreements, etc.), there would be a corresponding change in the 2020 and forward estimates.
As algorithms in the underlying data sources improve, they continue to discover more content. This means that the apparent volume of output (OA or not) is appearing to grow retrospectively. This may not indicate “more stuff” – just that we are better at finding it. We continue to refine how we estimate open access as our underlying data sources evolve, and our survey sample continues to increase.
Patterns of open access output vary considerably depending on how open access is defined. For the purposes of estimating market size, we focus on articles published under any Creative Commons (CC) licenses. We feel the trends in CC licenses represent a reasonable view of the reality of commercial OA activity, even though not all comply with all OA mandates or definitions. We have discussed this in other venues and will explore it in more depth in our upcoming webinar.
Trends
- Growth is slowing, although it remains in double digits, and is still well ahead of the underlying journals market.
- The growth curves show signs of flattening out to a steady state of just over 10% annual growth in both volume and value of OA.
- Hybrid revenues realized per article published are higher than those published in fully OA journals, but the gap is narrowing. Those for articles in fully OA journals show signs of long-term increases, whereas those for hybrid appear to be flattening. This may partly be due to how revenues are allocated with mixed-model deals.
The trends mask important nuances. Individual publishers exhibit different dynamics, which is not surprising given how varied their portfolios can be.
- Annual phasing varies between publishers. Some publishers in our sample produced less than their trend in one year but make up the shortfall in the following year, or vice-versa. Others saw accelerated growth in a particular year, driven by increased publication volumes and/or increased prices. As a result, we see fluctuations in the overall numbers for year to year. However, the underlying trends appear to remain consistent.
- Hybrid proportion and growth varies considerably among publishers and can reflect timing in output or acquisitions.
- Payments per article vary wildly depending on the sample. For example, the Open APC data suggest higher-than average numbers, reflecting their focus on high-output and European institutions. Meanwhile, some segments of the market may see fully OA APCs that are higher than hybrid APCs (counter to the overarching market averages).
- Regions vary greatly. Waivers offered to low-GDP countries and how OA is funded are highly variable.
Conclusion
Based on current trends, the open access market remains buoyant and set to grow significantly faster than the underlying scholarly journals market.
Open access output now accounts for at least 30% of publications when looking at any CC license, but that drops markedly if focusing on only the most permissive licenses. Likewise, by counting anything that is open to read (but not necessarily to reuse), then over half of output is open.
The proportion of money spent on open access continues to lag the proportion of output, but it continues to gain ground. It is driven principally by increasing volumes of output, although pricing policies can help drive revenues for some.
In our view, the drivers of cancellations of big deals, the rise of transformative agreements, and perhaps the emerging growth of non APC-based subscription models, will continue to accelerate the spending on open access. Subscription access payments will inevitably be squeezed, and fully OA activity is taking an increasing share of value. Meanwhile, many areas of the world with high OA adoption have low GDP and therefore limited effect on global payment averages. Funder mandates, transformative agreements, and cancellations of big deals may have a lesser impact on the OA landscape outside of Europe and North America.
The reality on the ground may change compared with the mathematical models we use. Once OA adoption in the vanguard regions reaches saturation, we may see growth of OA slow significantly as the remaining regions show weaker drivers. Additionally, our models do not account for COVID-19. Anecdotally, we know that submissions and publications have both increased over the past seven months for many journals. However, acceptance rates on these submissions are often reported at much lower levels than normal. Most publishers prudently anticipating a submission slow-down have not yet experienced it. Even if that research slowdown does not occur, the effects of shrinking GDP may dampen publishing revenues regardless of business model.
We have highlighted just a few of the trends that our Open Access Data and Analytics Tool explores in depth. We will be rolling these out for our subscribers shortly, including projections of spending and output over the coming 3-5 years.
This article is © 2020 Delta Think, Inc. It is published under a Creative Commons Attribution-NonCommercial 4.0 International License. Please do get in touch if you want to use it in other contexts – we’re usually pretty accommodating.