News & Views: Open Access is not just for Open Access Journals
As we start preparing for our annual market sizing survey, we take a look at the data on open access uptake we have seen so far in 2020.
In this article we will explore how open access compares with other types of access and how the balance of output between access models is shifting in unexpected ways.
Background
As we have discussed previously, we use data from Unpaywall1 to analyze per-article information about Open Access. The other major indexes use this data too. To perform a full analysis of the publishing landscape, we must also look at journals’ business models. As has also been discussed, there is no definitive index of journals available. Those that focus on OA journals focus only on fully OA . So, we finesse the per-article information by overlaying our own data about journal business models. Our data covers around 70% of articles indexed in Crossref since 2014.
We also need to define clearly “open access” which is used by different sources to mean different things. For our analysis, we use the “formal” definition of Open Access, as coined by the Budapest Open Access Initiative in 2002. “Open Access” requires that peer-reviewed articles are BOTH free of charge to read AND have permissive usage rights. Articles that are ONLY free to read, with NO permissive reuse rights we consider to be “Public Access” (sometimes called “Bronze”). We discuss the various definitions in a supplement to this article and note some further nuances below.
Open access uptake
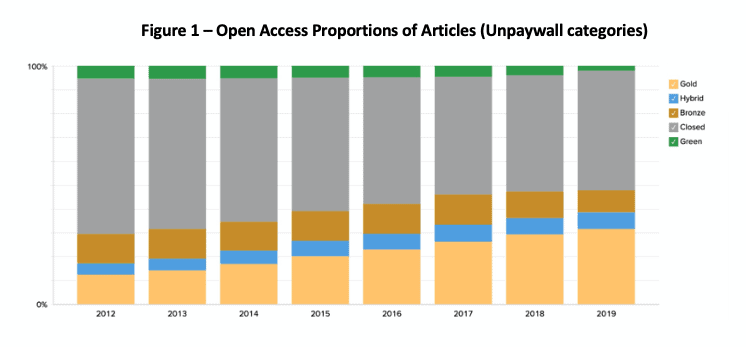
Figure 1 shows our estimates of OA uptake across all scholarly output, based on data from April 2020.
Sources: Crossref, Unpaywall, publishers’ pricelists, DOAJ, ROAD, Delta Think analysis.
© 2020 Delta Think, Inc. Published under CC BY-NC license; please see footnotes for details.
At first glance, this gives us a view of OA adoption. It uses Unpaywall’s OA status indicator. For example, in 2019 the % of total output accounted for by:
- “Gold” (articles in Fully OA journals, shown in yellow) was around 32%.
- “Hybrid” (articles other journals, with open licenses, shown in blue) was around 7%.
- “Bronze” (articles in other journals, without open licenses, shown in bronze) was around 9%.
- “Green” (articles only available via legitimate repositories, shown in green) was less than 5%.
- "Closed” (articles which are not open to read from any legitimate source, in grey) form the balance.
Under our nomenclature, we might conclude that Open Access output – articles that are free to read and include permissive reuse rights – accounted for 39% of total output in 2019 (the 32% Gold OA plus 7% Hybrid OA). Public Access – free to read, without permissive rights – refers to the 9% Bronze.
The notable trend in the chart is that the growth in both Open Access and Public Access output appears to be slowing, with the curve of these appearing to flatten over time. Repository-only access (“Green”) appears to reach a steady state after a couple of years. We would expect this, given its commonplace connection to embargo periods.
But what exactly are we measuring?
Good though they are, the numbers above miss important details. For example, the Hybrid numbers include open access articles published both in hybrid journals, and in journals that offer no advertised open access option. We term these latter journals “not OA” but of course their publishers may choose to make selected articles in them open access (free to read and reuse), or public access (free to read only).
Similarly, articles which are “Closed” – which we take to be Paid Access – could appear in both sorts of journals. Such articles form the subscription part of hybrid journals, or the core part of not OA journals.
So, to uncover more detail concerning market dynamics, we need to separate the two sorts of “not fully OA” journals. Figure 2 below shows this separation and tells us what happens when we determine the proportions of article output within each type of journal.
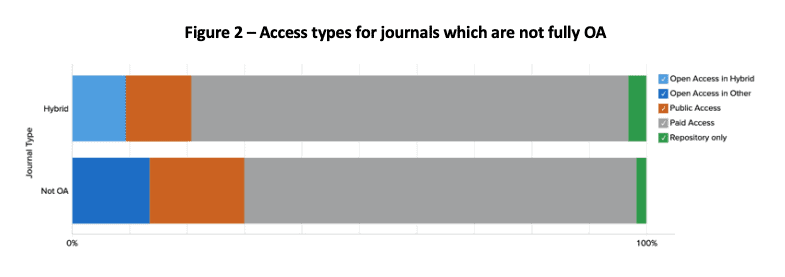
Sources: Crossref, Unpaywall, publishers’ pricelists, DOAJ, ROAD, Delta Think analysis.
© 2020 Delta Think, Inc. Published under CC BY-NC license; please see footnotes for details.
Here we analyze just 2019’s data and have not shown fully OA journals for clarity. We have also replaced the color-based nomenclature with names describing access type.
- We can see that the Open Access option (in blue) accounts for just under 10% of the output in hybrid journals compared with the 7% or so we saw across the market.
- Around 75% of output in hybrid journals is Paid Access (in grey), compared with 50% or so across the market.
- Given this, we might conclude that hybrid has just under 10% uptake of Open Access.
We can also use this break-out to assess what might happen if hybrid journals flipped. Assuming submissions stay constant, the currently Paid Access proportion gives us our maximum additional APC-based income. The economics of the Public Access content depend on how much the market would pay to flip the license to an open access one given the content is already free to read. Pressure to reduce subscription prices (and even flip to OA) could be determined by adding the open and public access components, as neither require subscriptions. At a little over 20%, this is not insignificant.
Perhaps the most surprising finding in content outside fully OA journals, is that journals with no OA option make proportionally more content Open Access and Public Access than their hybrid counterparts. The full data set in Delta Think’s OA Data and Analytics Tool allows us to analyze this over time; although not shown here, this seems to be a trend over time.
Conclusion
Literature search strategies focus on finding articles, and so looking at per-article access options is useful and relevant for researchers. Here we see that the proportion of content that is Open Access and Public Access is growing, although the growth appears to be slowing.
However, for publishers and librarians, more information is needed about parent journal types and different access models. Without this, it is not possible to understand trends in the market. With it, we can quantify the uptake of Open Access options in hybrid journals and tease out nuances between journal types.
The analysis above just scratches the surface of what we can achieve by combining multiple data sets and performing a joint analysis. Are things different for society-owned journals? What about for major publishers compared with the market average? Or for the very largest publishers? How do different disciplines compare? Might trends change in response to emerging policies and activities?
The answers to these questions will vary among organizations, of course, and require further analysis. Meanwhile, we leave you with the following (perhaps counterintuitive) finding. Across the market as a whole, it seems that you are LESS likely to find OA content in a hybrid journal which offers OA options, than in a journal with no advertised OA options at all.
Stay well and have a good month.
This article is © 2020 Delta Think, Inc. It is published under a Creative Commons Attribution-NonCommercial 4.0 International License. Please do get in touch if you want to use it in other contexts – we’re usually pretty accommodating.
1 “ Unpaywall is an open source application that links every research article that has been assigned a Crossref DOI (more than 100 million in total) to the OA URLs where the paper can be read for free. It is built and maintained by Our Research (formerly Impactstory), a US-based nonprofit organization.” – The Future of OA: A large-scale analysis projecting Open Access publication and readership. Piwowar, Priem, Orr. Oct 2019. https://doi.org/10.1101/795310.