News & Views: Open Access Books

This month we examine how the growth of the Directory of Open Access Books (DOAB) has developed over the last 18 months. We look at some key statistics from the Directory and examine the continuing growth in OA Books.
Background
The Directory of Open Access Books (DOAB) tracks academic books, which “must be made available under an open access licence and be subjected to independent and external peer review prior to publication”. It is a useful proxy for how the OA books market is developing.
We have previously analyzed how it was growing and its composition. Around 18 months later, we update our analysis to see how things have changed.
Growth of the DOAB
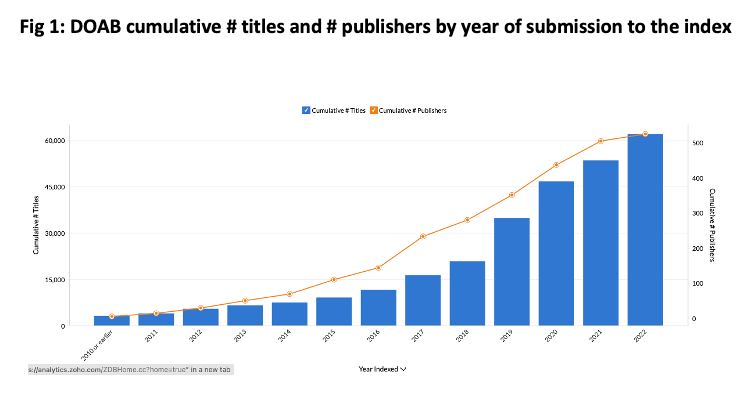
The DOAB now claims to have well over 60,000 titles, and continues to grow. The chart below shows how the index has grown.
Source: DOAB, Delta Think Analysis. © 2023, Delta Think Inc. All rights reserved.
The chart above shows the cumulative number of titles and publishers growing over time.
- The number of titles has doubled since our last analysis, to just over 60,000 from around 500 publishers1.
- There was a 17% year-on-year growth in the number of titles from 2021 to 2022.
- The rate of growth is slowing: The 5-year CAGR from 2017-2022 is around 36%.
- There are now 525 publishers registered in the index, up from around 490 at the time of our last analysis.
- As with the number of indexed titles, the number of publishers continues to grow, but at a slowing rate.
- Our previous analysis excluded titles with an unspecified Indexed year. Our current analysis includes all titles, using their publication year as a proxy for their indexed year if the latter is not specified.
Leading publishers using the DOAB
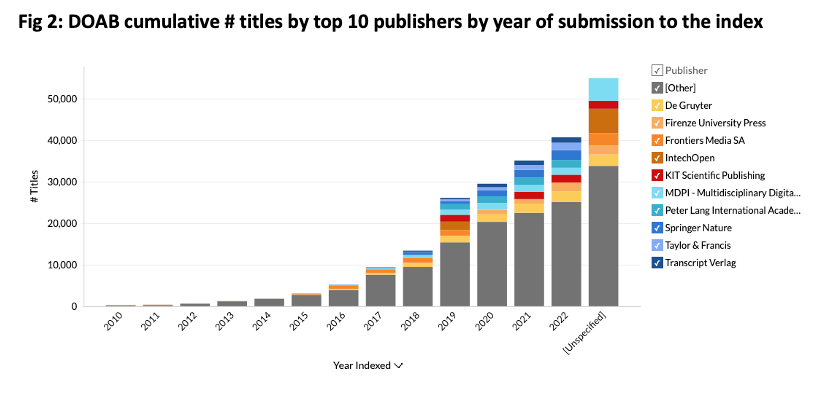
The chart below analyses the larger contributors of data to the DOAB.
Source: DOAB, Delta Think Analysis. © 2023, Delta Think Inc. All rights reserved.
The figure above shows the cumulative number of titles added to the index over time by the top 10 publishers.
- The books market is consolidated: The top 10 publishers account for around 48% of total output.
- Consolidation has been increasing, with the top publishers taking increasing share over time. From 2018, the few larger publishers have increasingly started to dominate.
- Around 16% of the records do not specify when the book was added to the index. (These are shown in the right-most column.) This speaks to some issue either with publishers’ deposition of metadata or the indexing itself. A subset of the larger publishers covers a disproportionally large share of these unknown years.
DOAB Largest Publishers Analyzed by License Type
Publishers deposit information about books retrospectively.
Source: DOAB, Delta Think Analysis. © 2023, Delta Think Inc. All rights reserved.
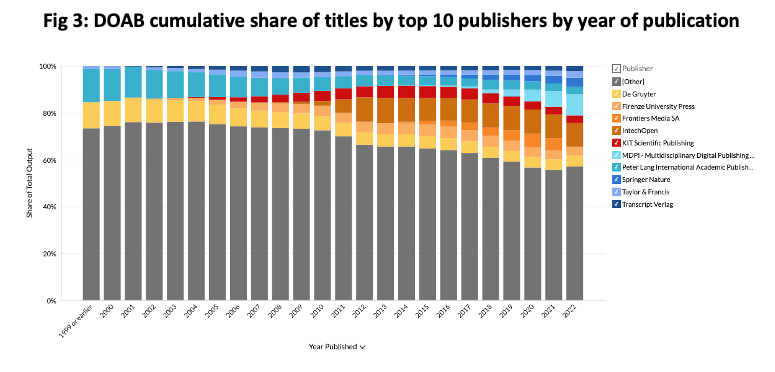
The chart above analyses share of output by year of book publication, rather than the year in which a book’s metadata was indexed.
- Again we see a consolidated market. For titles published in 2022, the 10 largest publishers together account for around 43% of the index.
- Consolidation by year of publication has slowly increased until 2021, but is showing signs of reversing. It’s too soon to tell if this is a reversal in trend or just a one-off.
- Across all years, IntechOpen remains the largest publisher (9.6% share), followed by MDPI (8.5%) and then de Gruyter (4.8%).
- Another 595 or so publishers lie outside the top 10.
Conclusion
The DOAB continues to see strong growth, and continues to outpace the growth in journals. Over the 5 years to 2022, its CAGR was 34%, compared with 22% for OA journal articles.
Growth has previously been driven by larger organizations coming on board, plus a growing long tail of publishers joining OAPEN. However, with the growth in the numbers of publishers slowing, it seems that the index is increasingly reflecting the underlying growth in the market, rather than a growth in the adoption of its infrastructure.
Books show less consolidation than journals. The top 10 OA book publishers cover around 45% of book output, while the top 10 OA journal publishers account for around two thirds of OA journal output. This may partly reflect the greater maturity of the journals market. However, it’s likely to be a systemic reflection of how books scale differently.
Users of our OADAT can explore the data in much greater depth, including drilling into the usage of licenses, subjects, and languages.
We will run further analysis of some of these other areas later in the year.
This article is © 2023 Delta Think, Inc. It is published under a Creative Commons Attribution-NonCommercial 4.0 International License. Please do get in touch if you want to use it in other contexts – we’re usually pretty accommodating.
1Methodological note: Our analysis of DOAB metadata returns totals slightly lower than the DOAB’s own headlines, as we filter out book chapters, records with sparsely populated metadata, and have only plotted items until the end of 2022.