News & Views: Can open access be made more affordable?
This month we look at the challenges of providing global access to OA in an equitable way. Among the many issues discussed, a central one is cost. We look at how prices could be changed to match local affordability… and turn up some surprising results.
Background
Cost is key in the active discussions around the challenges to providing equitable access to OA. Modest fees for one country may be very expensive for another, particularly for the less wealthy regions outside the US and Europe.
cOAlition S, UNESCO, the International Science Council (ISC), the Open Access 2020 Initiative (OA2020), Electronic Information for Libraries (EIFL), the Association of African Universities, and Science Europe are organizing a series of workshops on global equity in Open Access publishing. OASPA has convened a series of workshops that examined equity in pricing models for all forms of OA business models – “to help dismantle the financial barriers authors face to participation [in OA]”. cOAlition S has commissioned a study to explore a “globally fair pricing system for academic publishing.”
One of many ideas being discussed is basing fees upon what is affordable locally, rather than pricing them at an identical level for customers irrespective of their geographic location. Precedents exist, such as the tiered pricing of vaccines.
Quantifying affordability
To work out pricing based on affordability, we need to account for how cheap or expensive things are between different countries. Exchange rates alone don’t account for local spending equivalence.
The Big Mac index1 illustrates the problem, as it allows us quickly to compare a similar item across many countries. If currency exchange rates reflected local purchasing power, then a $5.36 Big Mac in the US would cost the local currency equivalent of $5.36 everywhere. However, a Big Mac costs the local currency equivalent of, for example, $7.28 in Switzerland, or $4.44 in Brazil2.
Such Burgernomics provides an easily digestible example of the principle of quantifying differences in affordability between countries. In practice, economists use Purchasing Power Parity (PPP), which uses a complex sample of goods and services for its calculations.
How affordable are things around the world?
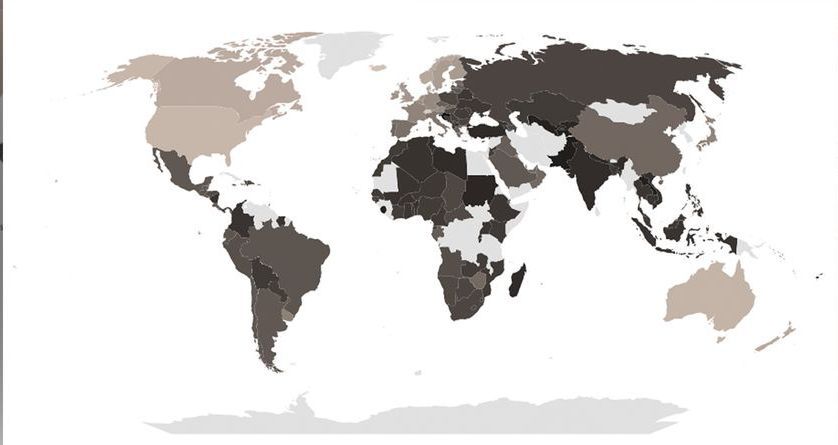
The map below compares the differences in purchasing power around the world.
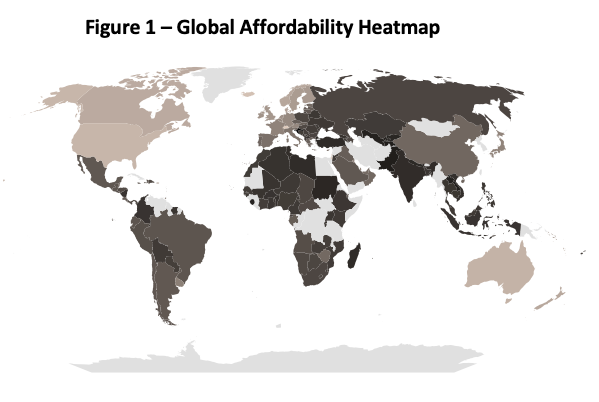
Source: World Bank, Delta Think analysis. © 2023, Delta Think Inc., all rights reserved.
The map’s shading indicates the ratios of PPP in USD (purchasing power) to currency exchange rates for US dollars. They can be used to visualize the local affordability of prices based on currency exchange rates. The darker the area, the less affordable prices are due to weaker local purchasing power. There is arguably over-charging in these areas. Conversely, the lighter the shade, the more affordable prices are. (Note, the very lightest areas – such as Antarctica along the bottom – have no data.)
Unsurprisingly, high-income countries – such as the US – can better afford things compared with low-income countries – such as many in Africa. However, the middle ground is quite extensive. For example, it includes many countries in Europe, even though Europe is considered a wealthy area of the world.
Making prices affordable
If open access prices were to be set based on affordability, then what sort of discounts – or increases – might be needed to make them equitable?
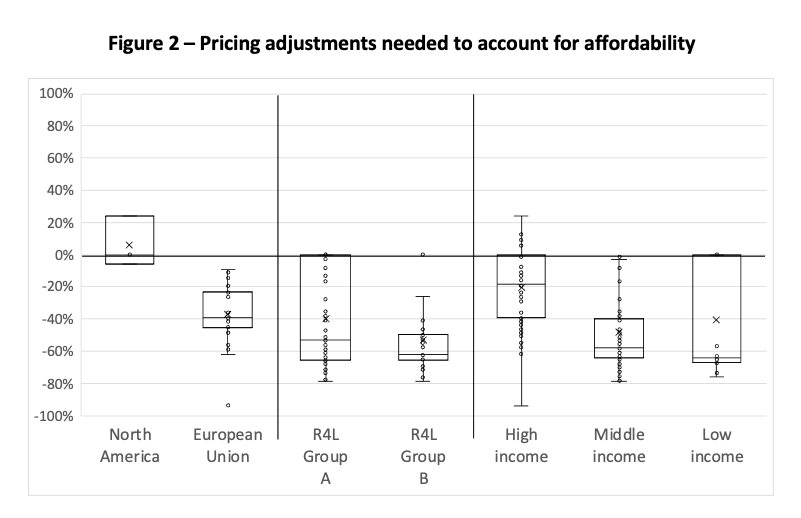
Source: Delta Think market data, World Bank, Reasearch4Life, OpenAlex, Delta Think analysis. © 2023, Delta Think Inc., all rights reserved.
Figure 2 is a box plot showing how prices might need to change to reflect affordability based on local purchasing power (PPP). The horizontal line at 0% represents current state pricing. There is one dot per country. The dot’s distance from the 0% baseline represents how much prices in the country would need to change to reflect affordability based on PPP. The dots are not labelled to indicate country, as the point of the chart is to show the overall patterns.
To help put the comparison in context, we show different combinations of countries. These are the vertical groups of dots: N. America and Europe, Research4Life (R4L) eligibility (Group A/free and Group B/low-cost), and World Bank Income categories. Countries may appear in more than one group. The hollow boxes show the two middle quartiles for each group, with the horizontal line across the box showing the median change. For example:
- The dots for the US require no change (as PPP is set relative to USD), and so will appear on the 0% line. Its dots appear in the leftmost group (N. America) and the High-income group, but not in the R4L groups, as it is not eligible for discounted prices.
- Brazil would require 50% price discounts to reflect its PPP. Its dot is plotted at the -50% line in the Middle-income group (the only category it falls into in our chart).
- Switzerland at 25% is the outlier in the High-income category.
What is striking in Figure 2 is the middle quartiles of almost every group of countries are entirely below 0. In other words, it is not only the case that lower income countries have lower purchasing power, requiring downward adjustments on prices for parity. It is the case that most countries have lower purchasing power than the very few (including many countries in the Global North, in Europe, or of High Income).
As a result, estimating the effects of the entire market moving to a solely PPP-based model, we see overall market value (aka market cost to those paying to participate) dropping by roughly 34%.
If we assume that a market value adjustment of the magnitude illustrated above would not be the end state, what type of pricing increases would be needed to offset pricing power parity? Assuming a case of full recovery of revenue (not likely, but it represents an interesting like-for-like comparison model), who would pay what?
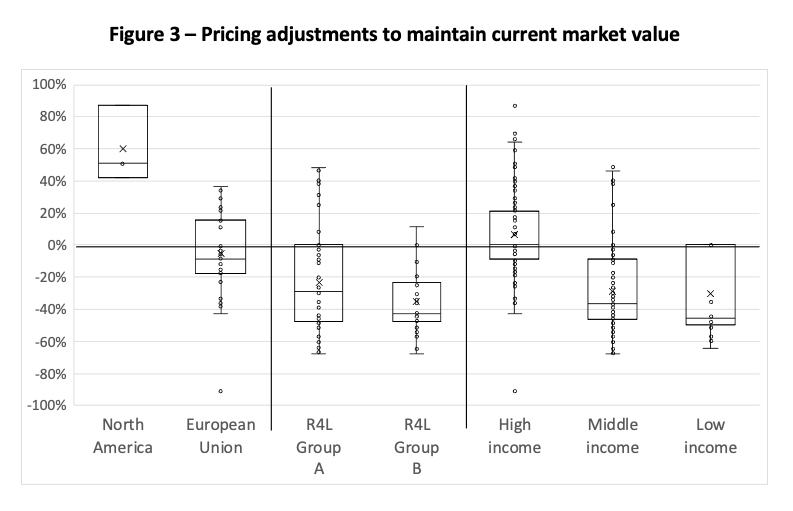
Source: Delta Think market data, World Bank, Reasearch4Life, OpenAlex, Delta Think analysis. © 2023, Delta Think Inc., all rights reserved.
The bars in Figure 3 show how prices would need to change to both reflect PPP and maintain current total market value. This allows us to visualize what the current market might look like if it were priced according to affordability.
Countries with stronger PPP would subsidize weaker ones, but, again, the results turn up surprises. For example, the top quartile of countries in the Research4Life Group A (free access) would see price rises, while over half those in the High-income category, or over half of Europe would require price cuts.
For context, in our burgernomics examples: Prices would need to reduce by 50% in Brazil to reflect PPP alone, or by 25% to maintain total market value. Switzerland would see price increases of 10% (PPP only) or 66% (market adjusted). And the home of the Big Mac? 0% (for PPP only – PPP is in $USD), or an increase of 51% (market adjusted).
Conclusion
There are many issues surrounding equitability of OA publishing, but affordability remains the major one.
The APC barrier effect suggests that “APCs impede researchers with fewer resources in publishing their research as OA”. Transformative Agreements (TAs) and Read & Publish (R&P) deals, which may base their pricing on APCs, can bring similar problems of affordability to those of APCs themselves. The expense of subscriptions too, even for the wealthy, has been discussed at length, and their cost is one of the drivers behind advocacy of a move to OA. Affordability is an issue whatever the business model.
Waivers are the usual fix, but they can be problematic. Their implementation varies, and they may be perceived as patronizing or undermining the dignity of those receiving them (“Waivers are a charity; why can we not pay in our own way with our own money?”). Waivers are typically applied based on World Bank income categories, but, as our analysis of its data shows, these may not match affordability.
At first glance, exploring a PPP-based pricing model is attractive. It strikes at the heart of affordability, by accounting for participants’ ability to pay. However, as we have seen, it is not that simple. A move to PPP, in most cases, causes price increases for many (some of which are unexpected) to subsidize the others that need more affordable options. This may result in some controversial changes. That impact would be magnified if publishers attempted to adjust prices upwards overall to counteract market value shrinkage.
A PPP based pricing system, while attractive in principle, would need to be carefully implemented in practice. Prices or pricing tiers would need to account for more than the raw numbers. Optics would need to be carefully considered. There will be winners and losers. And, like William Gibson’s view of the future, they will be unevenly distributed.
For those interested in exploring this topic further, we have developed a tool to help organizations explore affordability-based scenarios. Please get in touch.
1The Big Mac index was invented by The Economist in 1986 as a “lighthearted guide to whether currencies are at their “correct” level. It is based on the theory of purchasing-power parity (PPP), the notion that in the long run exchange rates should move towards the rate that would equalise the prices of an identical basket of goods and services (in this case, a burger) in any two countries.” Further color was added in a 1994 article in the UK’s The Independent newspaper – Nick Wiseman, a statistician with the Economist, said: “We are often asked why we don't use the price of the Economist or of prostitutes instead. The former is printed in various places and the price is not uniform while the cost of the latter may depend on local custom.” The term burgernomics was coined by editor Pam Woodall at the same time the Big Mac index was first produced.
2The Economist Big Mac index, January 2023 figures, taken as a proxy for 2022 end of year.
This article is © 2023 Delta Think, Inc. It is published under a Creative Commons Attribution-NonCommercial 4.0 International License. Please do get in touch if you want to use it in other contexts – we’re usually pretty accommodating.