News & Views: Library Spending and the Serials Crisis

Academic library budgets are the primary source of revenue for scholarly journal publishing. Given the global economic uncertainty surrounding Covid-19, this month we examine the outlook for academic library spending.
A Core Source of Revenue
Academic libraries are the majority contributor to scholarly publishing revenue streams. Although exact estimates vary, around 90% of scholarly journal market revenues come from subscription (or subscription-related) revenues, and 75% of that from academic libraries.
Libraries have been concerned that rises in the cost of purchasing journal subscriptions has significantly outpaced inflation. This is often referred to as the “serials crisis” by librarians and publishers alike. It has been noted for at least the last 25 years. Although some may suggest that it is specific to the 1990s, others suggest that it is an ongoing phenomenon.
Spending by Libraries
Industry figures are typically reported or gathered annually and stated at current market values. Of course, when analyzing them over time, we need to adjust for inflation. We do this using both the sector-specific Higher Education Price Index (HEPI1) and the general Consumer Price Index (CPI). Figure 1 shows the results.
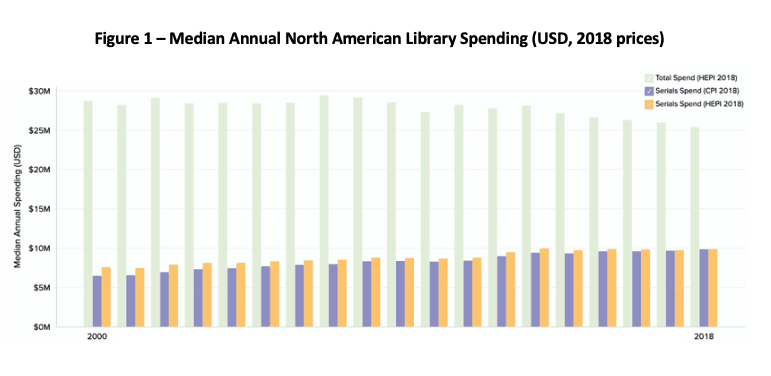
Sources: ARL, Commonfund Institute, Delta Think analysis. © 2020 Delta Think, Inc.
We can see that median spending on journals (“serials”) continues to increase in real terms (regardless of the inflation index used), while overall library spend are now declining. This suggests that budgets, too, are in real terms decline. Note: The sample2 includes 100 universities in the US and 16 universities in Canada, covering many significant academic libraries.
Library Spending vs. Publishing Activity
Actual prices paid by libraries are not available. Deals are usually confidential, and pricing includes a mix of print, digital, bundles, and discounting. However, by comparing library spending on serials with other measures, we can get a read on the challenges at work. Figure 2 shows a mix of measures, indexed to the year 2000 so you can see relative movement over time.
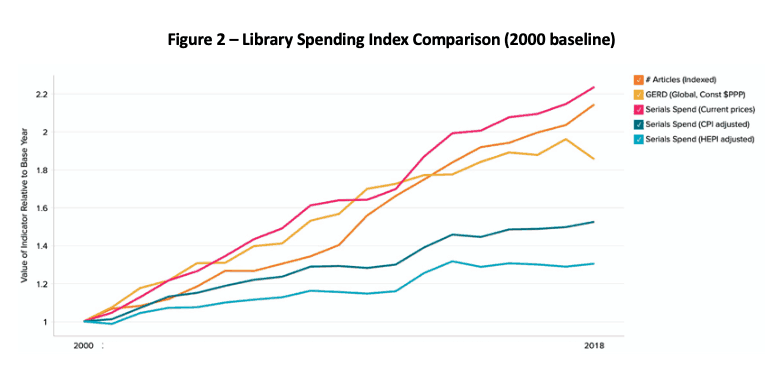
Sources: ARL, Commonfund Institute, SCImago (Scopus), OECD (2020), Delta Think analysis. © 2020 Delta Think, Inc.
Although spending on serials is growing faster than inflation, the data suggest that this headline masks a complex story.
- Serials spending as stated (the pink line) is the fastest growing of the indicators and appears to be outpacing growth in scholarly output and GERD3.
- However, when adjusted for inflation (the bottom two blue lines), serials spending is the slowest growing of our measures.
- The inflation measures average around 2% - 3% per year, compared to headline price increases exceeding 5% experienced by many libraries.
- The numbers of articles in the indexed literature (in orange) roughly tracks inflation-adjusted GERD (in yellow), as we explored last month. Both are growing at 2-3 times the rate of spending on serials.
- The unit of purchase for subscriptions is typically the journal (whether bundled or not); the number of indexed journals (not shown) is growing at a similar rate to CPI-adjusted serials spend.
- Since 2013, real-terms growth in serials spending has slowed – the HEPI-adjusted amount is flat-lining – while publishing output has continued largely unchecked.
As ever, subscribers to our database can drill into the details and explore further measures.
Conclusion
Analyzing data on library spend can be problematic. At the core of the debate is how value is defined. As well as issues of pricing itself (discounting vs. retail; print vs. digital; current prices vs. inflation-adjustments), many measures can be examined by studies looking at the costs paid by libraries. These include cost per article read, cost per download, cost per citation, costs relative to Impact Factor, or costs relative to selectivity (or “prestige”) of journals.
Whatever the definition, it is clear that in real terms, serials spending is growing, and is taking an increasing share of library budgets (from around 25% share in 1998 to just under 40% share in 2019 in our data). In this sense, there is a “serials crisis.” Trends such as falling costs per download and rising usage add further tension. The argument that libraries are getting “more stuff” is used by many to justify increased prices (and increased costs).
If publishing output has grown faster than serials spending, then the difference suggests publishers have not raised prices commensurate with growth in output. The data suggest that the fundamental problems lie with flat library budgets, which are failing to keep up with increases in spending on R&D in the Higher Education sector. Over the last twenty years, university budgets have almost doubled in real terms, while the proportion spent on libraries has almost halved.
Arguments that an increase of research volume should translate to library price rises are not new. Neither is the question of how sustainable such price increases are, as output continues to outstrip library budgets. Given the current state of the world economy, could this lack of scalability be exacerbated by more rapidly tightening library budgets? Will we see the current configuration of business models finally run out of runway? Is the longstanding way in which research is disseminated becoming strained to the point of obsolescence?
We are sure that the debate about value will continue. However it takes shape, the bottom line is that if libraries don’t have the budget, they can’t spend the money – no matter how good the deal on offer.
1 The Consumer Price Index (CPI) accounts for inflation based on a typical “basket of goods” and will be familiar to many. However, academic spending needs are different to those of the consumer. So we also use the Higher Education Price Index (HEPI), which we think better represents the inflationary pressures on US Academia. The HEPI is increasing on average 20% faster than CPI, suggesting that costs for Higher Education institutions in general are rising faster than those for consumers. We do need both indexes, however, as Macroeconomic Indicators typically use CPI to adjust for inflation.
2 ARL Statistics 2017-18, Association of Research Libraries, Washington, D.C.
3 GERD: “Gross domestic spending on R&D is defined as the total expenditure (current and capital) on R&D carried out by all resident companies, research institutes, university and government laboratories, etc., in a country. It includes R&D funded from abroad but excludes domestic funds for R&D performed outside the domestic economy. This indicator is measured in USD constant prices and Purchasing Power Parities (PPPs)” It is inflation-adjusted based on the CPI.